


Regardless of whether you are a senior programmer or a novice programmer, you will always run it after writing it, but it may not be executed as expected. Once this happens, finding out the cause of the problem is the only way for every programmer. Whether it is unfamiliarity with the grammar or logical problems, sometimes staring at the program code for hours still cannot find the crux of the problem. At this time, relying on debugging tools will get twice the result with half the effort. The VS Code tool supports multiple development languages and Extensions. I still remember that the author installed it before Python extension for VS Code After expanding the package, it can easily become an IDE development environment. Let’s talk about this debugging environment and application.

用 Telegram 訂閱【挨踢路人甲】最新文章:https://t.me/itwshare
Install the Python extension for VS Code extension kit, and your Visual Studio Code will easily have IntelliSense, linting, debugging, code navigation, code formatting, Jupyter notebook support, refactoring, variable explorer, test explorer, snippets and many other functions. What is commonly encountered is the IntelliSense and Auto-Completion functions that are provided when writing Python. Although they are helpful for writing program syntax, they cannot fully display the problems and bugs of the program. At this time, the debugging environment must be used to gradually execute the program code to easily find the location of programming errors.

To enter a debugging environment, setting a breakpoint is a very important action, because this breakpoint is the position where your execution stops. Click on the line number on the left side of the figure below and a red Breakpoint will appear. This red point is the position where the debug execution will stop later.

Generally, the execution button in the green box on the upper right or the [CTrl + F5] shortcut key is used to execute the test program. Of course, you can also directly enter “python program name.py” on the terminal program screen. So how to start debugging? It’s very simple, just use the function representation [Run] → [Start Debugging]. The author always uses the [F5] shortcut key for convenience.

At this time, enter the Debug Configruation menu (it seems that Chinese appears after upgrading VS Code 1.47), select “Python file to detect the python file currently in use”.

At this time, the program will run to the break point you specified (blue box). In the red box are the quick buttons that can be executed in Debug, and in the green box you can see the values of the variables. How come the variables i and j stop at i=4 and j=2? This is mainly related to the break point you specify. In the figure below, the break point is entered for the first time when i=4 and j=2, so the break point must be specified skillfully.

After the program entering the break point is run, the quick button aboveF5 (continue),F10(next line),F11(Enter),Shift + F11(jump out),Ctrl + Shift + F5(restart) andShift + F5(stop).

The author pressedF10 (Step Over) jumps to the next execution line. At this time, the i variable becomes 5, and the icon symbol table in the red box is the current execution position.

Press againF10 (Step Over) goes down to the if judgment.

Click againF10 (Step Over) does not stop at the break point. That is because the judgment is a prime number, so it does not enter the break point in if (i%j==0).

Keep pressing F10 (Step Over) to understand the operation of multiple loops step by step, allowing you to have a deeper understanding of loops.

During debugging, you can also change variables at any time. For example, when entering i=3 and j=1 in the figure below, the author clicked the i variable twice and modified the content to 6. After pressing F10, I found that the terminal screen had started from 6×1=6.

You can try changing any variable, and sometimes debugging will help you find the problem.

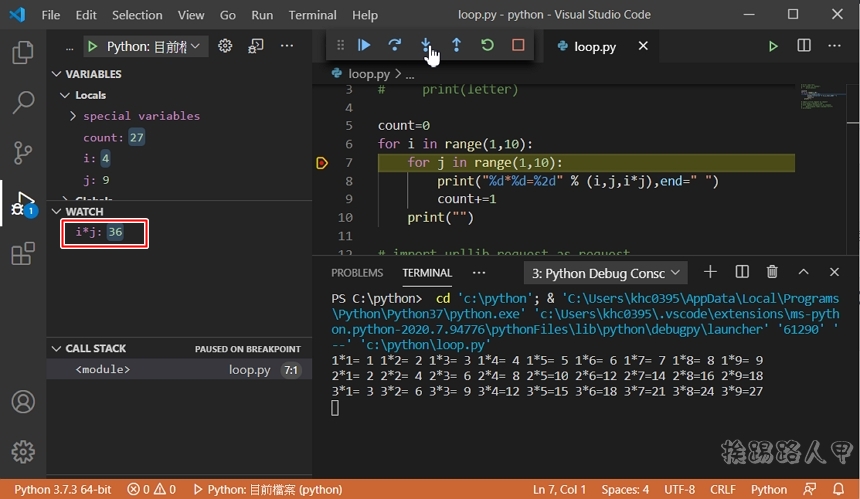
In addition to existing variable viewing, you can also customize calculation variables. As shown below, press the [+] icon button in the WATCH area to add the calculated values you want to view.

For example, the author enters i*j to view the changes.

Press F10 to experience it yourself slowly. Instead of looking at the instructions on the screen, try it out yourself!
Further reading:
Source: KOCPC Chinese