


Brazilian GPU repair channel “Paulo Gomes” recently revealed a hidden feature that has never been disclosed by NVIDIA: In fact, each graphics card has an independent temperature sensor under each memory particle. The practical significance of this discovery is very important: when the graphics card causes the system to crash due to uneven thermal paste, poor local heat dissipation, or abnormally high temperature of a single memory particle, maintenance personnel can finally pinpoint which memory has the problem, instead of just seeing an integrated value and blindly guessing as in the past.
The Discovery: From GPU Hotspot to VRAM Sensor
“Paulo Gomes” is a well-known local GPU repair and modification team in Brazil. In the past, it has become famous for its hardware modification projects such as upgrading GTX 9070 to 7GB VRAM and doubling the memory capacity of RTX 2080. Recently, they have launched challenges to NVIDIA’s temperature monitoring mechanism.

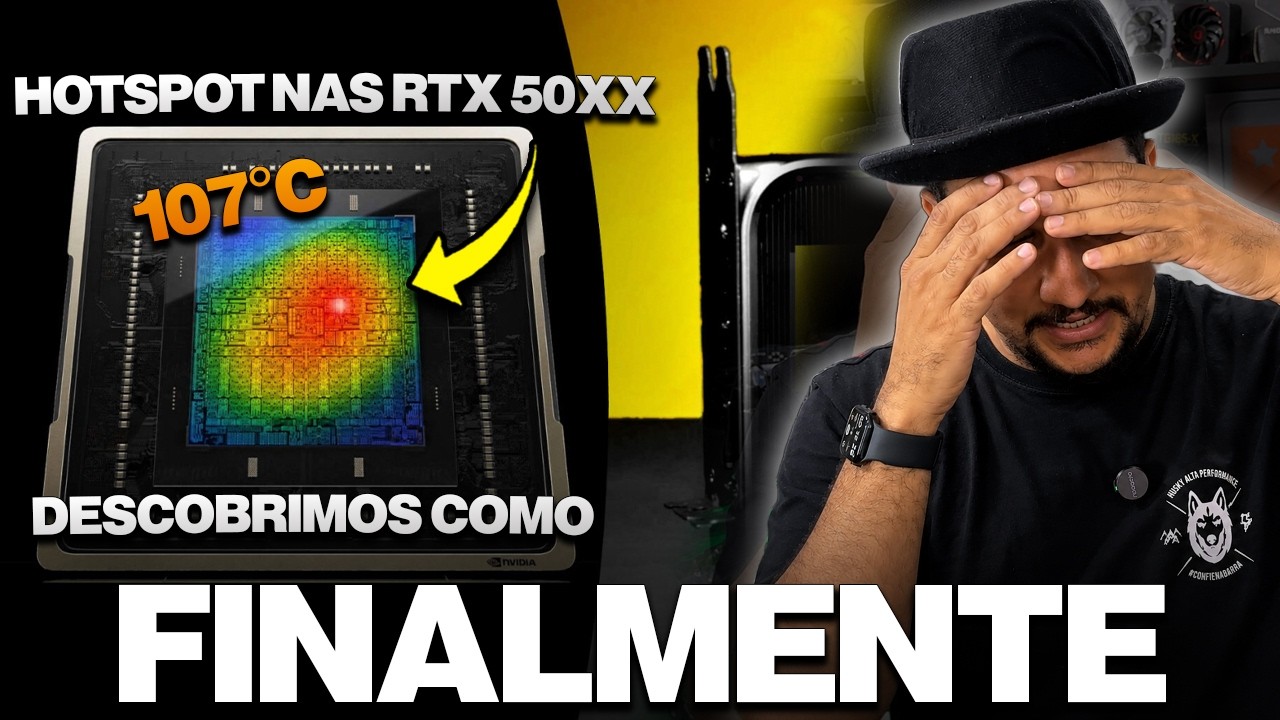
First, in early July 2026, the team discovered that NVIDIA had removed third-party software’s access to the GPU Hotspot temperature sensor in the RTX 50 series (Blackwell architecture), but it could still be read through NVIDIA’s internal diagnostic tool MODS. When they measured an RTX 5070 Ti, they found that the “average” temperature displayed on the screen was only 67°C, but the Hotspot temperature actually reached 107°C, triggering the underclocking protection.
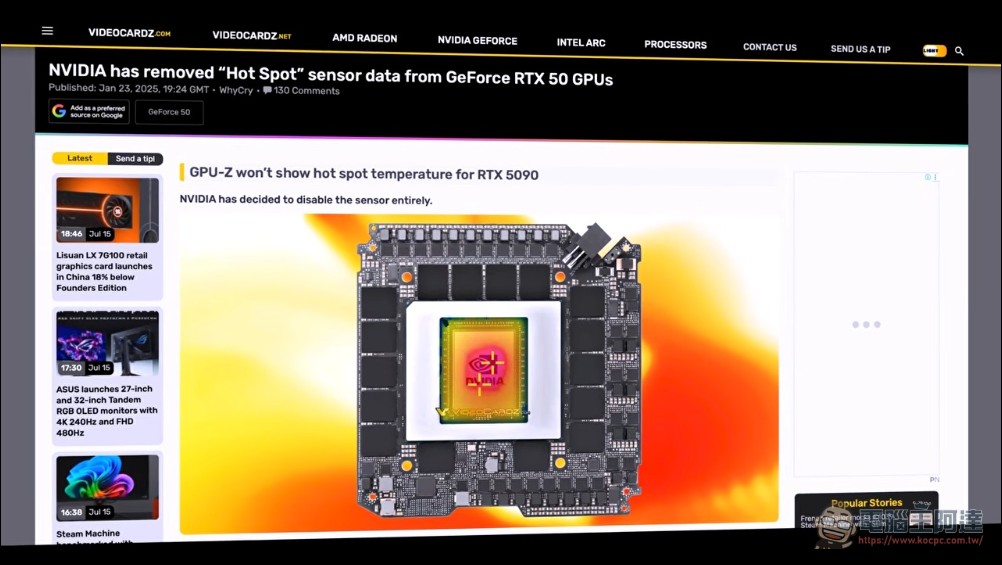
Subsequently, the team expanded the scope of investigation from the GPU chip itself to VRAM memory particles, and found that NVIDIA also buried an independent temperature sensor under each GDDR6 / GDDR6X memory particle, and had never disclosed this feature to the public.
Crack method: MMIO memory mapping
“Paulo Gomes” uses memory mapped input and output (MMIO, Memory-Mapped I/O) to directly access the underlying register data of the GPU, bypassing the abstraction layer of the driver, and obtains the temperature value of the corresponding channel of each memory particle. MMIO is a technology that allows the CPU to map the control register of a hardware device to the memory address space. Software can directly communicate with the hardware through memory read and write operations without the need for additional I/O instructions.
In actual testing, the team used an NVIDIA GeForce RTX 3080 for verification. The results showed that the temperature of the particles in one of the memory channels was as high as 86°C, but the temperature of the memory particles in other locations at the same time was significantly lower. This means that the card has a local problem of poor heat dissipation, which may be caused by aging and uneven adhesion of the thermal paste, or poor design of the heat dissipation duct at that location.
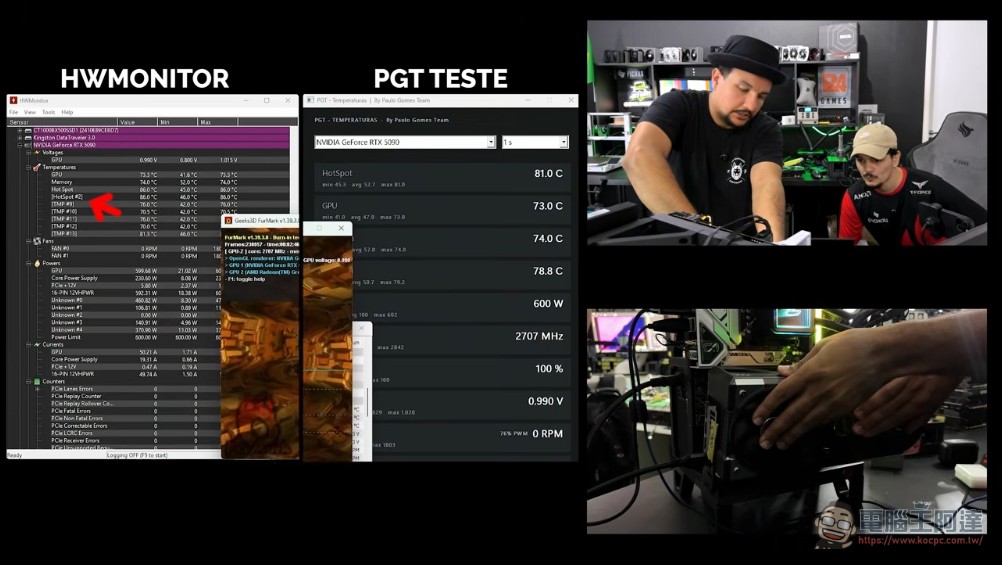
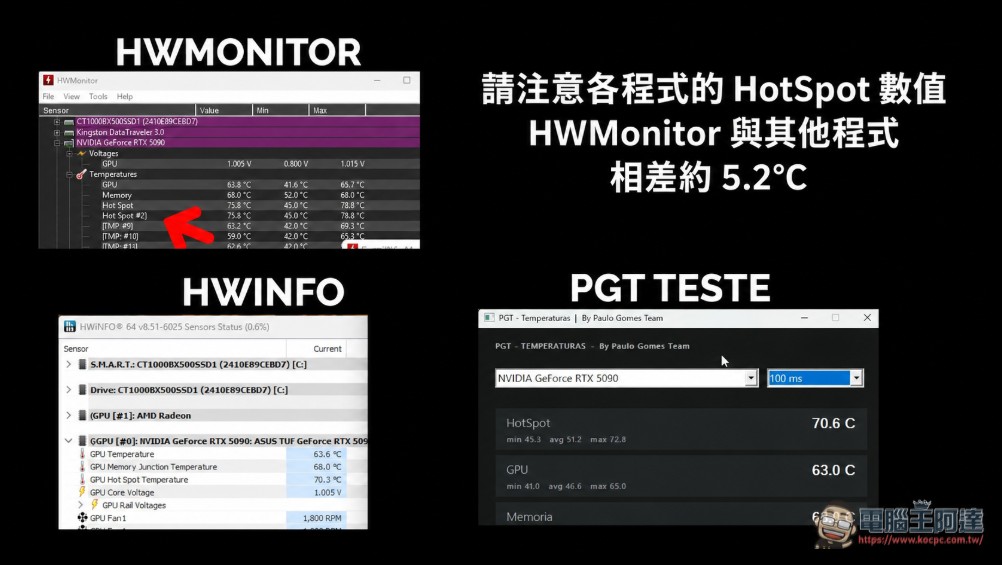
In the past, when using software such as GPU-Z to view VRAM temperature, it was generally believed that this value was the average temperature of all particles. But the team confirmed that the software always returns the highest Hotspot temperature among all particle sensors. This means that if only one memory is overheating, the user will see a high value, but will not be able to determine which memory has the problem. In addition, they also noticed that the hot spot temperature displayed by HWMONITOR was about 5 degrees different from that of other programs. He felt that this problem had a great impact on troubleshooting (originally in Portuguese, I speak Chinese).
All RTX 30 and RTX 40 series have been cracked, RTX 50 and GDDR7 are under research
“Paulo Gomes” stated that the team has completely cracked the individual temperature values of the GDDR6 and GDDR6X memory particles equipped on all RTX 30 series and RTX 40 series GPUs. We are currently studying how to extend support for this technology to the latest GDDR7 memory (for RTX 50 series), and plan to share relevant technical details with the development team of hardware monitoring software so that this function can be integrated into daily detection tools such as GPU-Z and HWiNFO in the future. Friends who are interested can watch the video below, and you can turn on cc subtitles and translate it into Chinese.
In addition, HWMonitor has launched version 1.65 update in July, taking the lead in adding support for RTX 50 series GPU Hotspot temperature. This was driven by the Hotspot sensor research previously revealed by the Paulo Gomes team. If the cracking results of VRAM particle temperature can be successfully adopted by software manufacturers, in the future users will be able to see the real-time temperature of each memory on the monitoring panel, and the diagnosis of heat dissipation problems will be upgraded from “guessing” to “precise positioning.”
Why NVIDIA won’t expose hidden sensors
Why does NVIDIA design hidden sensors in the chip but prevent users from reading them? There is currently no official explanation, but there are several reasonable speculations. First of all, the sensor has a clear purpose in the factory testing and quality control stages, and NVIDIA’s internal tool MODS can read complete sensor data, including GPU Hotspot temperature. NVIDIA’s server- and workstation-class GPUs come with far more complete diagnostic tools than consumer-grade ones, proactively monitoring all aspects of the graphics card.
As for why the sensors of consumer products are locked, one possibility is to prevent users from having concerns or making warranty claims after seeing excessively high Hotspot temperatures. The actual test case of RTX 5070 Ti shows that when the Hotspot temperature of one of the memories reaches 107°C, it will trigger frequency reduction. However, if you only look at the “average” temperature of 67°C, the user will not find the problem at all (simply put, they are afraid of trouble).
Practical impact on maintenance and thermal diagnostics
This technology has the most direct value to GPU maintenance practitioners (people like Zhang Ge). In the past, when the graphics card had memory-related screen distortion, crashes or frequency reduction problems, maintenance personnel could only rely on experience to determine which memory may be abnormal, and then heat or replace them one by one to troubleshoot. With individual particle temperature readings, problem particles can be pinpointed, significantly reducing diagnostic time.
For ordinary users, this technology also has practical scenarios. When the cooling performance of a graphics card decreases and the thermal pads age after several years of use, if the monitoring software can display the temperature of each VRAM, the user can determine whether the thermal pads need to be replaced and where the pads need to be replaced, instead of disassembling the entire card and redoing it.
The “Paulo Gomes” team said they plan to disclose technical details to surveillance software developers. If GPU-Z or HWiNFO can integrate this feature in the future, thermal monitoring of NVIDIA graphics cards will enter a level of granularity never seen before.
Source: KOCPC Chinese