


This time Intel’s 13th generation mid-range preferred i5-13600K processor not only has the same clock settings as the i9-12900K flagship processor, but also has more cores and threads than the previous generation. The specifications are quite good, but has the actual performance really been significantly improved? Is it really worth upgrading for users of mid-to-high-end processors? You still need to measure it to know, and this article will bring you the performance measurement report of i5-13600K.
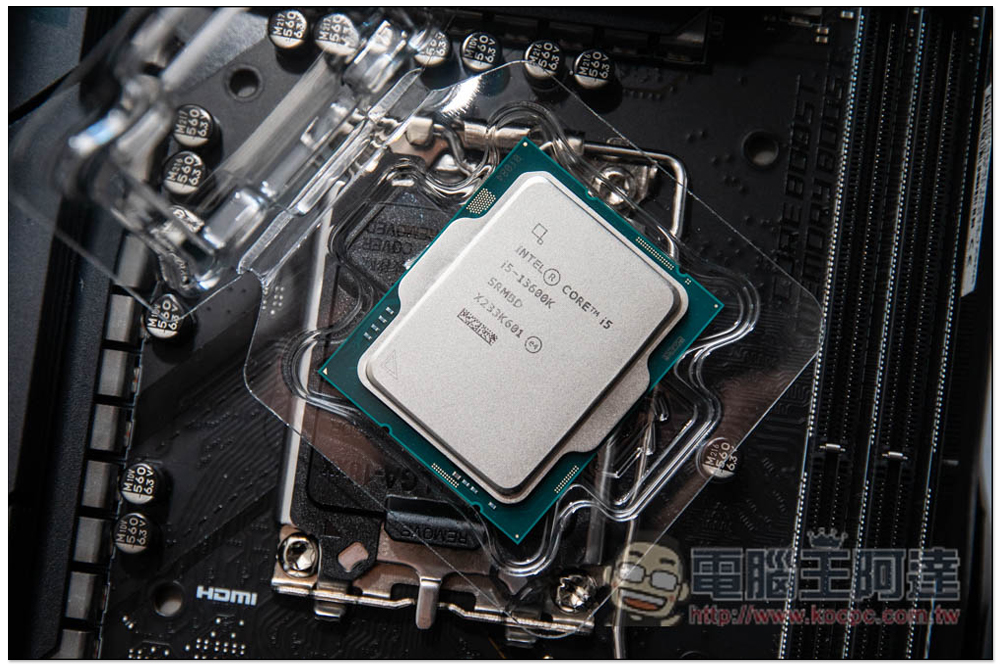
Raptor Lake vs. i5-13600K Specs Overview
As in the past, there are three models of the 13th generation Raptor Lake released by Intel this time, and they are all overclockable K series, namely “i9-13900K / KF”, “i7-13700K / KF”, “i5-13600K / KF”. The difference between K and KF is that the former has an internal display (Intel UHD Graphics 770), while the latter does not, and other specifications are the same, so Prices ending in K will be a bit higher.
Compared with the previous generation, Raptor Lake maintains the same hybrid architecture, but the number of cores and threads has increased a lot, and the memory also supports DDR5-5600 (the 12th generation only supports DDR5-4800). Taking the i5-13600K in this article as an example, it has 4 more E-cores than the previous generation:
- i5-13600K comes with 14 cores (consisting of 6 P-cores and 8 E-cores)
- i5-12600K comes with 10 cores (consisting of 6 P-cores and 4 E-cores)
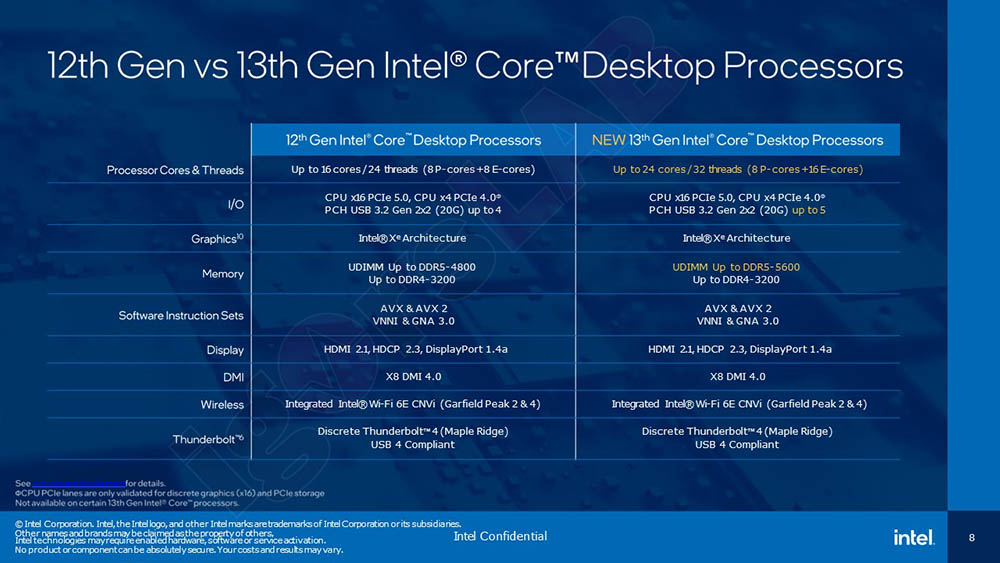
In addition, the detailed specifications are also different. L3 cache (up to 36MB) and P-core L2 cache are also added. The L2 cache sharing of each E-core cluster is also increased by 2 times.
- i5-13600K provides 24MB L3 cache and 20MB L2 cache
- i5-12600K provides 20MB L3 cache and 9.5MB L2 cache
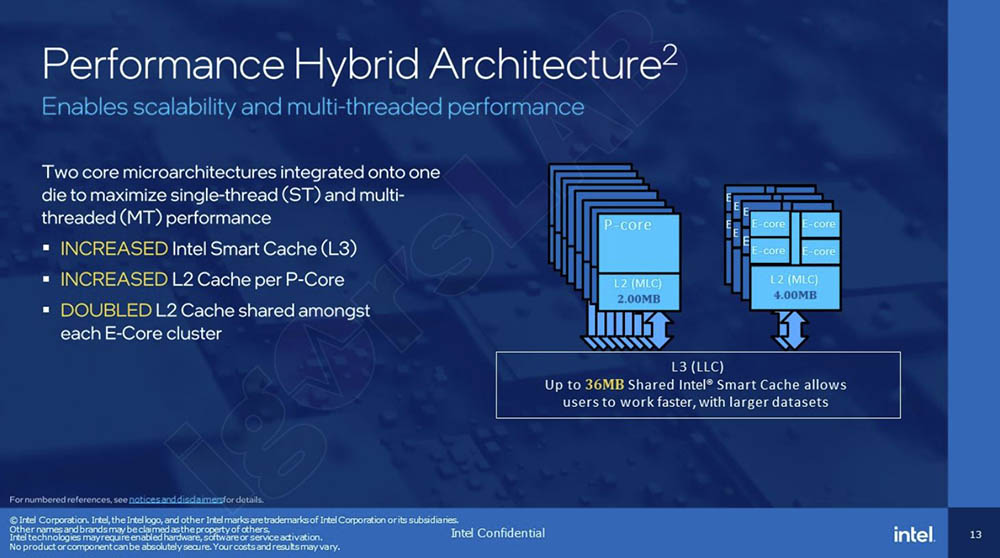
In the overclocking part, E-core and DDR5 have also been improved. More importantly, this generation also has a one-click overclocking function, which will be demonstrated to everyone below:
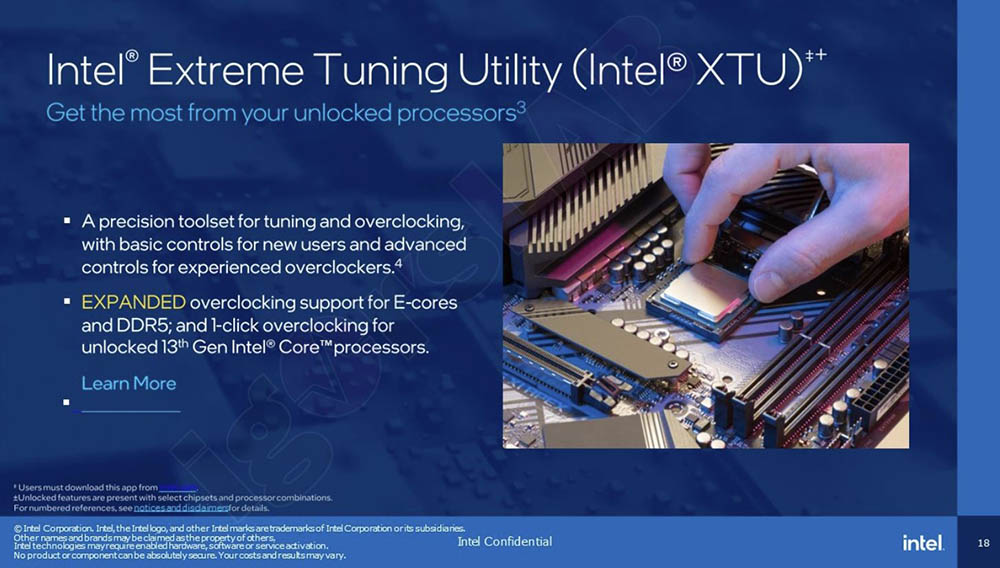
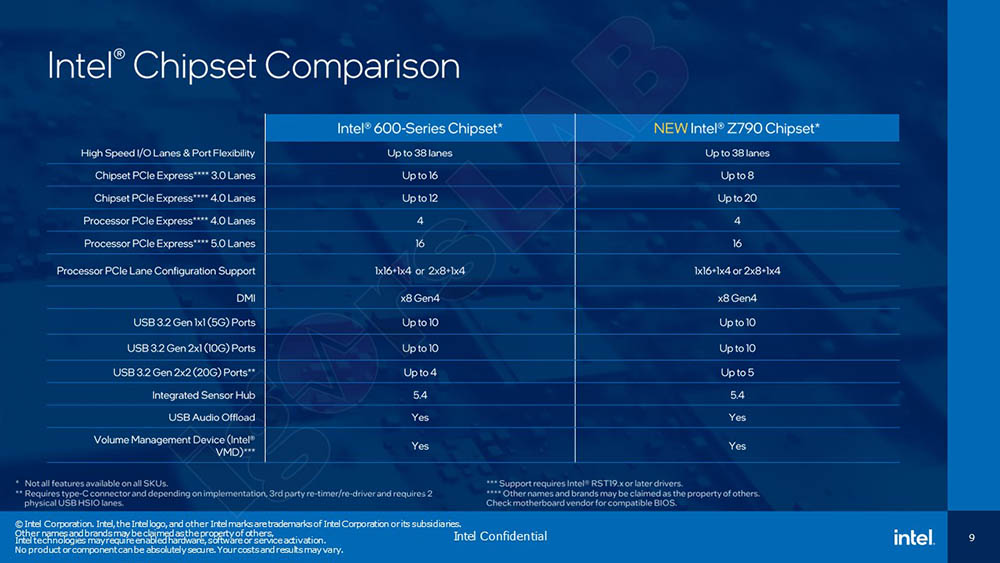
Finally, there is the difference between the new generation Intel Z790 chipset and the Intel 600 chipset. PCIe 4.0 has been increased to up to 20 lanes, and USB 3.2 Gen 2×2 (20G) has also been increased from 4 to 5:
i9-12900K vs i5-12600K vs i5-13600K Specification comparison:
| Core i9-12900K | Core i5-12600K | Core i5-13600K | |
| process | intel 7 | intel 7 | intel 7 |
| P-core quantity | 8 | 6 | 6 |
| E-core quantity | 8 | 4 | 8 |
| Total number of cores | 16 | 10 | 14 |
| total thread | 24 | 16 | 20 |
| Maximum overclocking | 5.20 GHz | 4.90 GHz | 5.10 GHz |
| P-core turbo boost clock | 5.10 GHz | 4.90 GHz | 5.10 GHz |
| E-core turbo boost clock | 3.90 GHz | 3.60 GHz | 3.90 GHz |
| P-core base clock | 3.20 GHz | 3.70 GHz | 3.50 GHz |
| E-core base clock | 2.4 GHz | 2.80 GHz | 2.60 GHz |
| cache | 30MB | 20MB | 24MB |
| L2 cache total | 15MB | 9.5MB | 20MB |
| Processor base power | 125W | 125W | 125W |
| Turbine power limit | 241W | 150W | 181W |
i5-13600K performance measurement
Below is the test platform. Friends who want to build a computer with this processor but don’t know how to match the hardware can refer to:
- Processor: Intel® Core™ i5-13600K
- Motherboard: MSI MPG Z790 CARBON WIFI
- Memory: G.SKILL TRIDENT Z5 DDR5-5600 16Gx2
- Hard drive: SPATIUM M480 PCIe 4.0 NVMe M.2 2TB
- Graphics card: EVGA GeForce RTX 3080 Ti
- Water cooling: Phanteks Glacier One 360MPH
- Power supply: Seasonic PRIME TX-1300
- Operating system: Windows 11 Pro 22H2
First, I used AIDA64 to perform a stress test and ran it for more than 30 minutes. I have to say that the water cooling of the Phanteks Glacier One 360MPH is really good. After such a long time, the maximum temperature of the Package did not exceed 75 degrees, and the average temperature was maintained at about 67 degrees. The maximum temperature of the P-core was 74 degrees, and the maximum temperature of the E-core was 67 degrees. This also made the clock frequency very stable. The P-core was basically at 4.8GHz, and the highest temperature was not touched. 5.1GHz, E-core is maintained at the high-end 3.8GHz, up to 3.9GHz:
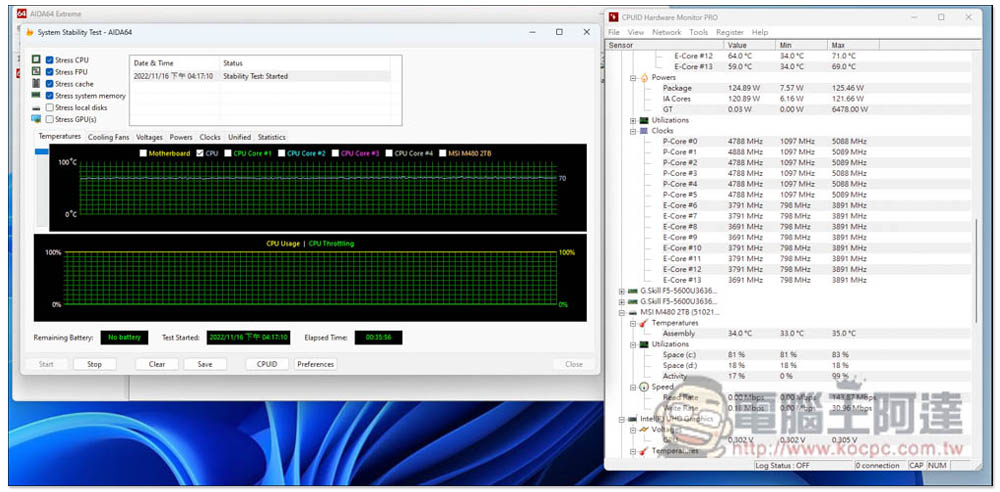
It can also be seen from this result that although the i5-13600K is a mid-range processor, a fan heatsink is usually enough. However, if you are going to use it for content creation, I would recommend using water cooling, so that when the load is high, the temperature can be effectively reduced, and the frequency will not be encountered when the temperature is too high.
Then Geekbench 5 was used to test the single-core and multi-core performance scores of the i5-13600K. The single-core score was 1954 points and the multi-core score was 16317 points. For comparison, the previous generation i5-12600K’s single-core score was 1838 points and the multi-core score was 11686 points, which were improvements of 6% and 29% respectively:
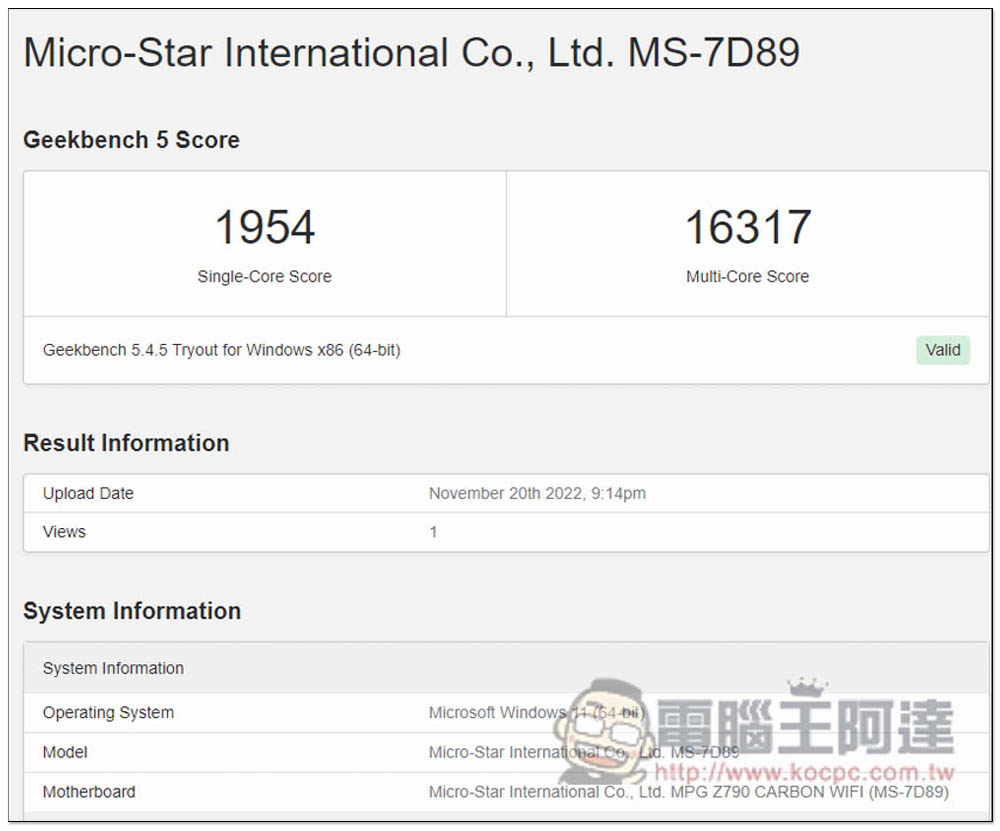
What is more worthy of reference is that the i9-12900K has a single-core score of 1915 in Geekbench 5 and a multi-core score of 16632. The performance of the i5-13600K is almost the same, which is really eye-catching. Unexpectedly, the 13th generation mid-range processor can beat the previous generation flagship processor:
| Geekbench 5 | i9-12900K | i5-12600K | i5-13600K |
| single core | 1915 | 1838 | 1954 |
| multi-core | 16632 | 11686 | 16317 |
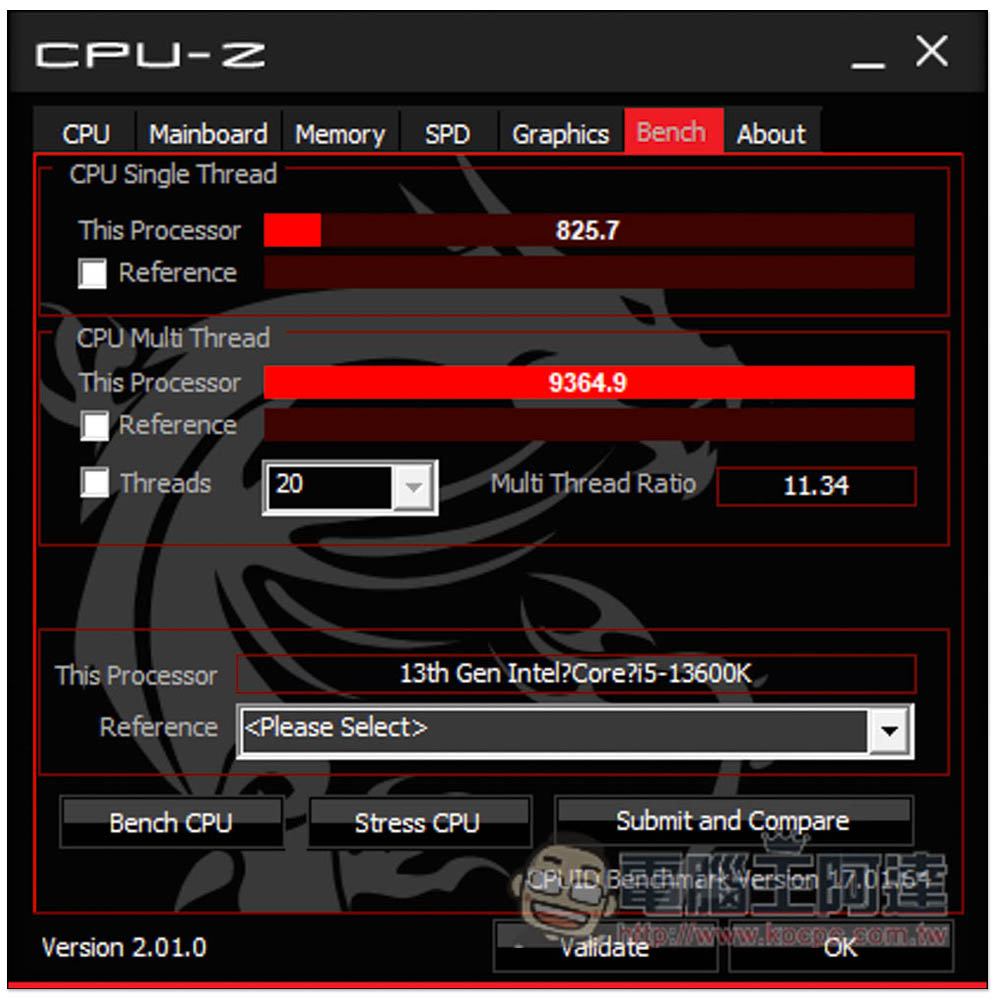
CPU-Z can test the performance of single-thread and multi-thread processors. The i5-13600K scored 825.7 for single thread and 9364.9 for multi-thread, which are 10% and 25% improvements over the previous generation:
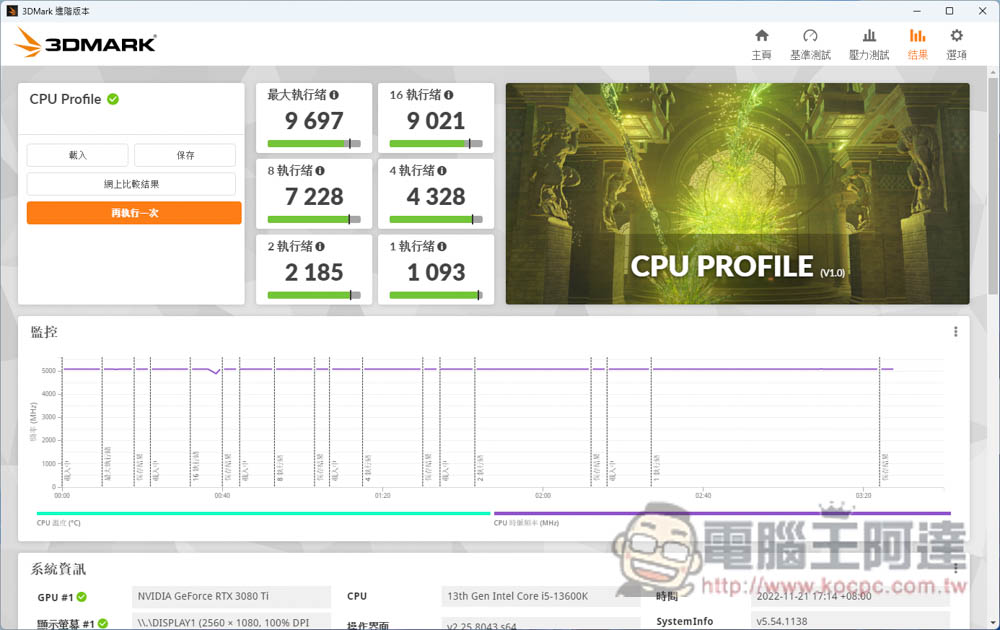
Although 3DMARK is mainly a software used to test GPU performance, it now has a CPU Profile mode that can test how much performance the processor can provide when using various numbers of threads. i5-13600K uses all threads and obtains a score of 9697:
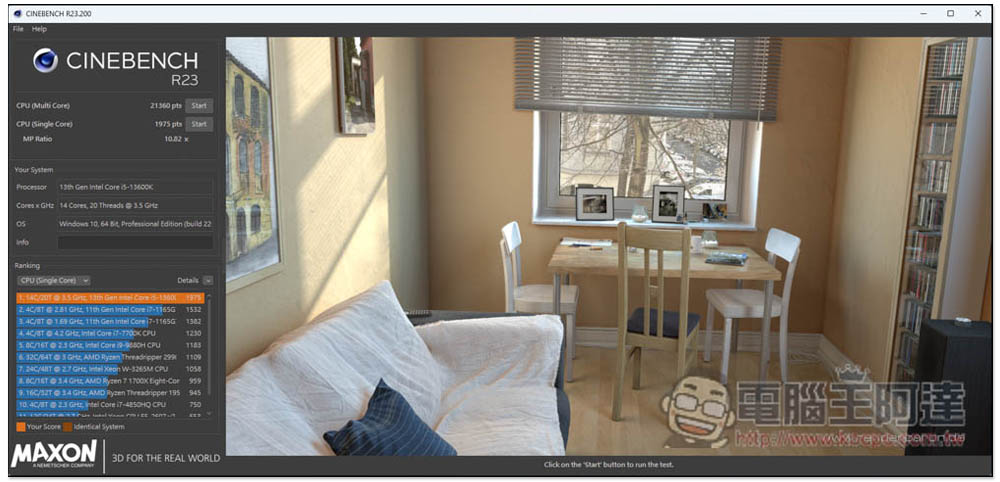
Next is Cinebench R23, which can test the CPU’s graphics computing capabilities. The multi-core got 21360 pts and the single-core got 1975 pts. The performance increased by 20% and 6% respectively:
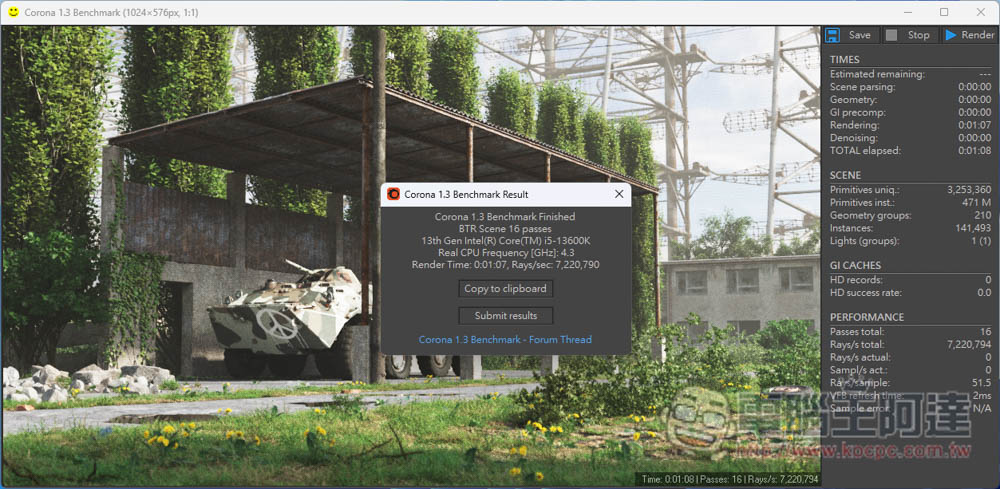
It is also the Corona Benchmark that tests CPU performance through graphics. The i5-13600K completed it in 1 minute and 7 seconds:
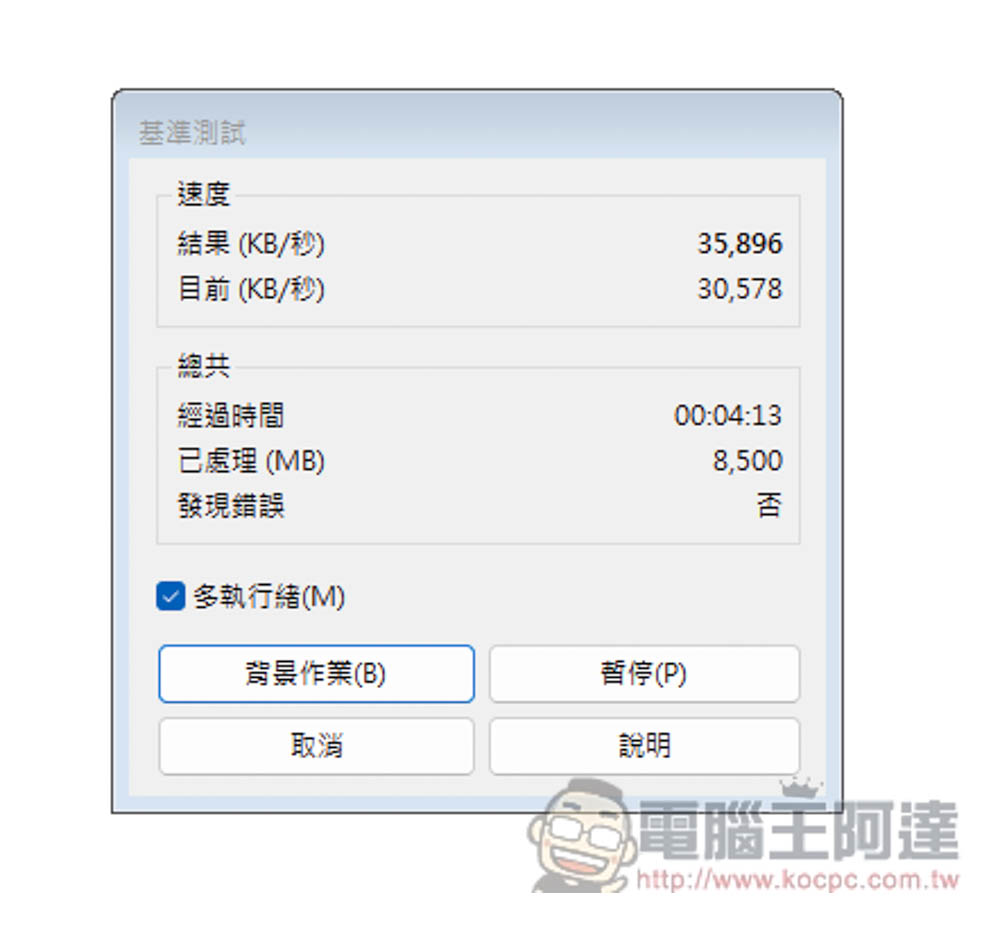
The WINRAR decompression software that everyone is very familiar with also has a built-in benchmark test and achieved 35,896 KB/s, which is quite good:
Another set of 7-Zip decompression software was also benchmarked and received an overall rating of 125,208 GIPS:
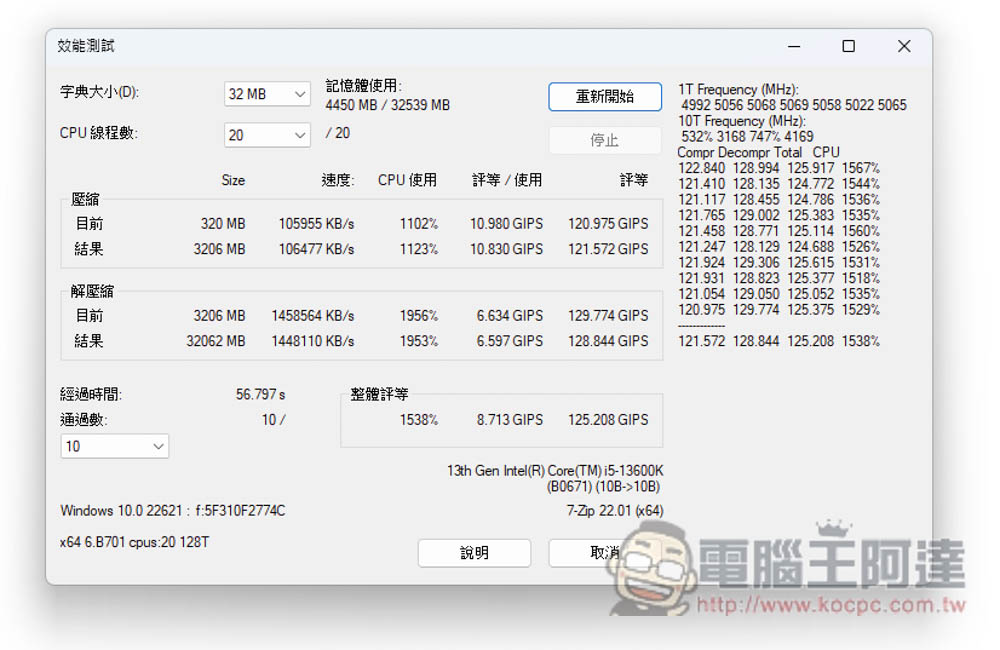
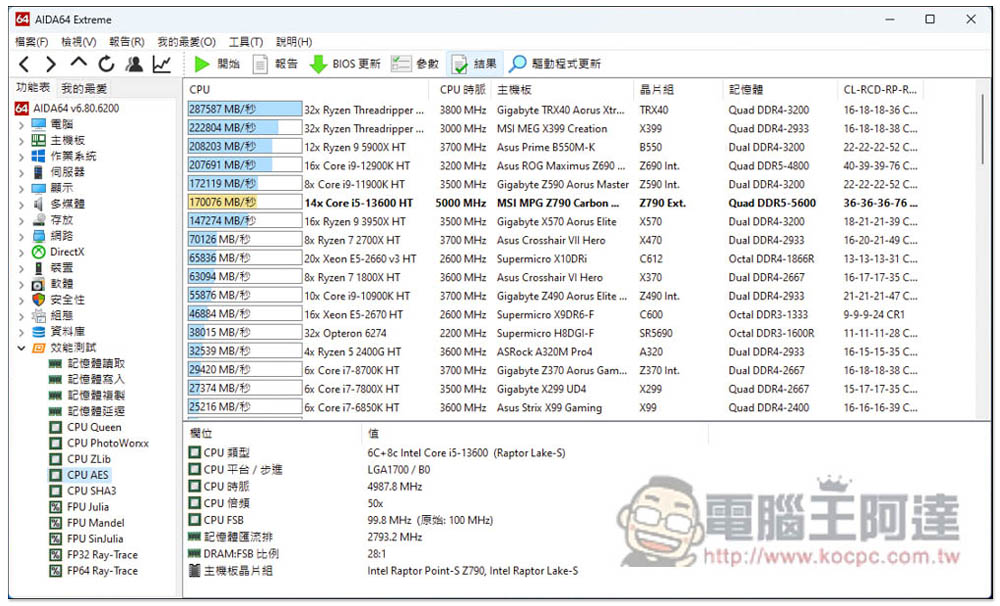
Encryption is the basis for secure network connections, and AES is the most common encryption technology today, so it is very important to be able to quickly encrypt and decrypt information. For this reason, we used AIDA64’s CPU AES test mode to understand the speed of the i5-13600K, which measured 166 GB/s. This speed can be said to be quite fast:
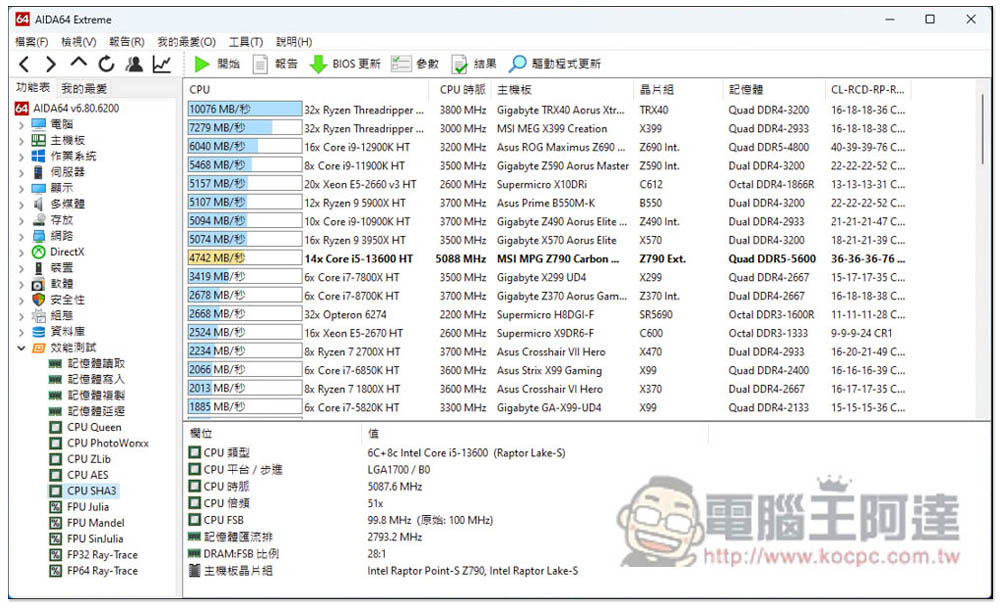
SHA3 is a secure hash algorithm that is often used for verification. The measured result is 4742MB/s, which is much faster than the 3660MB/s of i5-12600K:
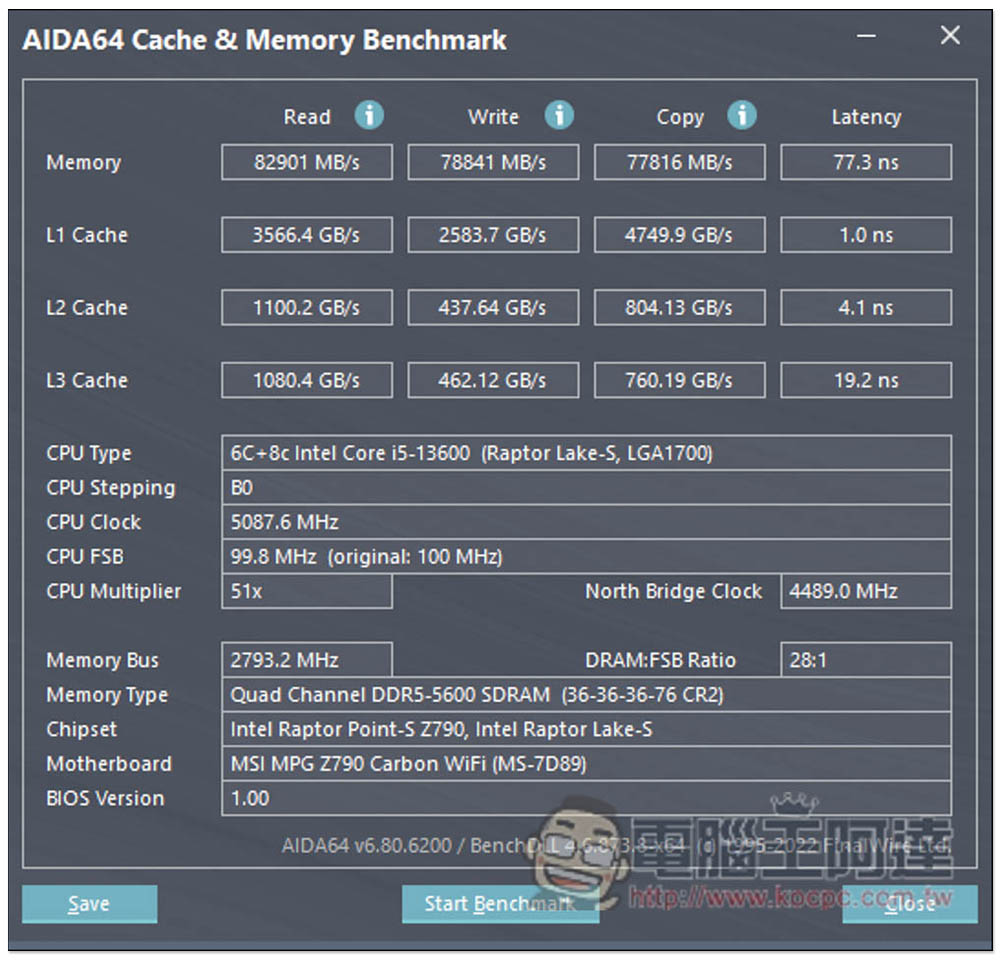
AIDA64 also provides cache and memory tests. This test can not only know how high performance it will bring with DDR5-5600, but also know the speed of L1~L3 cache:
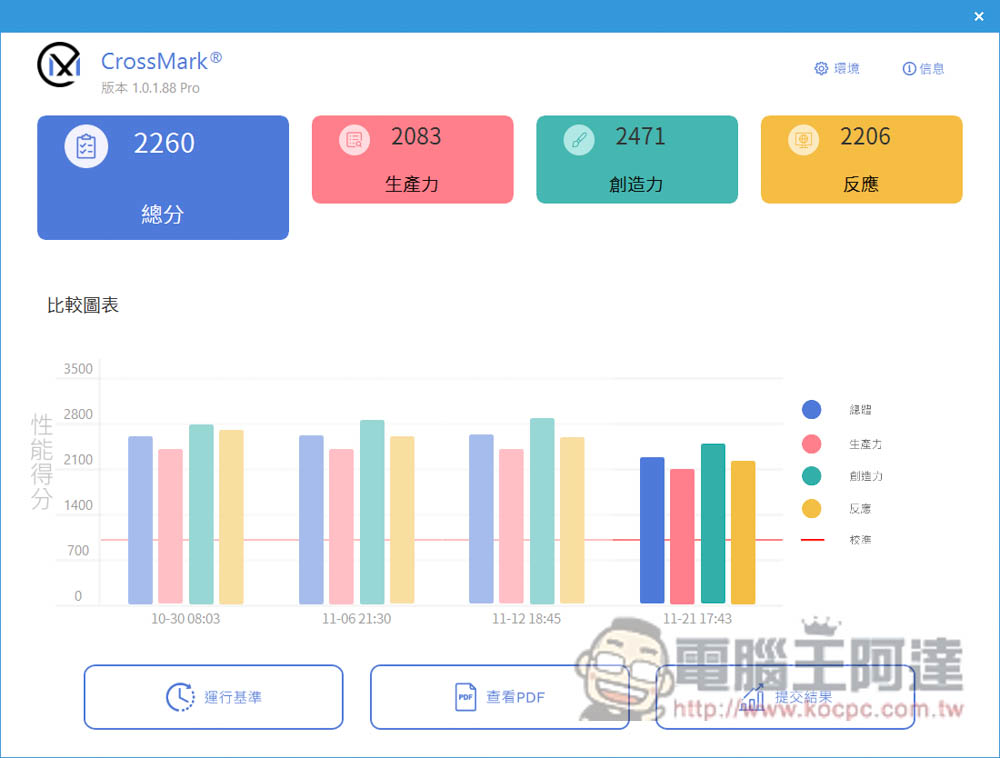
Next, look at the comprehensive performance test section. CrossMark will test the performance of the i5-13600K from three aspects: productivity, creativity and response, and finally obtain a total score of 2260. The first three results in the picture below are for i9-13900K:
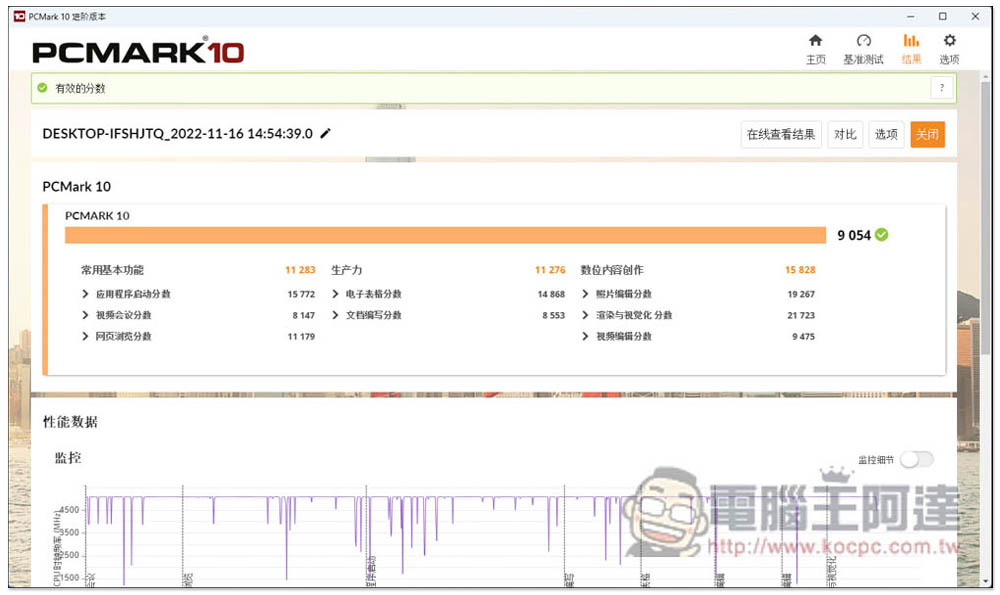
PCMARK 10 has three modes, and each mode tests different items. The picture below is the basic mode, which mainly tests computer performance from commonly used functions, productivity-related applications, and heavier digital content creation, and achieved a score of 9054.
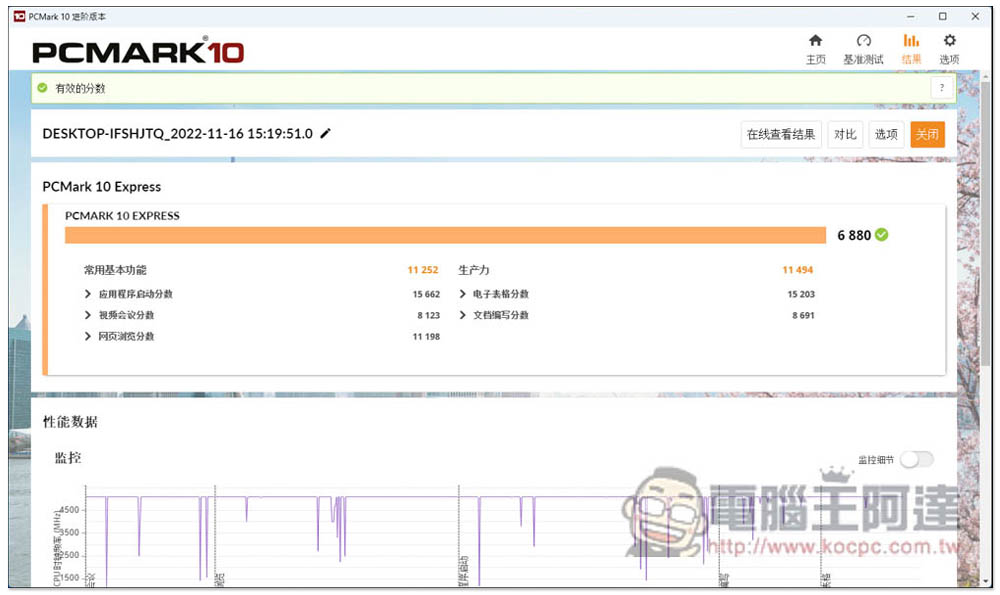
PCMark 10 Express focuses on home use, including common basic functions and productivity, so it is considered a relatively lightweight test mode, and finally scored 6880 points:
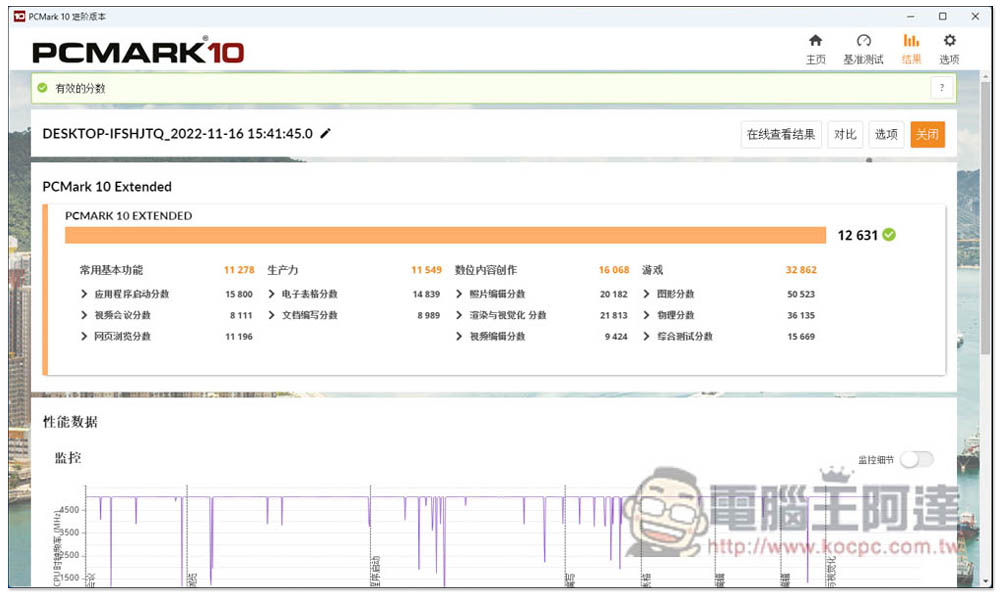
PCMark 10 Extended is the most stringent test mode, with an additional game test section, so it is the most worthy reference for players, and the i5-13600K did not disappoint, scoring 12631 points, which is quite a good result:
Finally, there is WebXPRT 4, which tests browser performance. This test will be conducted in 6 aspects, including photo enhancement, using artificial intelligence to organize photo albums, stock option pricing, Wasm-based encrypted notes and OCR scanning, sales charts and online operations. This part received 303 points:

After the overall test, the results are the same as the i9-13900K. Even if the architecture remains unchanged, the i5-13600K still improves a lot in performance compared to the previous generation, especially in the multi-core part, and some tests are similar to the i9-12900K, which is really eye-catching.
i5-13600K performance score summary table:
| Test software | model | Score |
| Geekbench | single core | 1954 |
| multi-core | 16317 | |
| CPU-Z | single thread | 825.7 |
| multiple threads | 9364.9 | |
| 3DMARK CPU Profile | Maximum thread | 9697 |
| 16 execution threads | 9021 | |
| 8 execution threads | 7228 | |
| 4 execution threads | 4328 | |
| 2 execution threads | 2185 | |
| 1 thread | 1093 | |
| Cinebench R23 | multi-core | 21360 pts |
| single core | 1975 pts | |
| Corona | 1 minute 7 seconds | |
| WinRAR | 35896 KB/s | |
| 7Zip | overall rating | 125208 GIPS |
| AIDA64 AES | 166 GB/s | |
| AIDA64 SHA3 | 4742 MB/s | |
| AIDA64 Memory | read | 82901 MB/s |
| write | 78841 MB/s | |
| clone | 77816 MB/s | |
| Delay | 77.3 ns | |
| AIDA64 L1 Cache | read | 3566.4 GB/s |
| write | 2583.7 GB/s | |
| clone | 4749.9 GB/s | |
| Delay | 1.0 ns | |
| AIDA64 L2 Cache | read | 1100.2 GB/s |
| write | 437.64 GB/s | |
| clone | 804.13 GB/s | |
| Delay | 4.1 ns | |
| AIDA64 L3 Cache | read | 1080.4 GB/s |
| write | 462.12 GB/s | |
| clone | 760.19 GB/s | |
| Delay | 19.2 ns | |
| CrossMark | total score | 2260 |
| productive forces | 2083 | |
| creativity | 2471 | |
| reaction | 2206 | |
| PCMARK 10 | 9054 | |
| PCMARK 10 Express | 6880 | |
| PCMARK 10 Extended | 12634 | |
| WebXPRT4 | 303 |
i5-13600K gaming test
In the game test part, the graphics card we used is NVIDIA GeForce RTX 3080 Ti, and the image quality is set to the highest.
“Ghostwire: Tokyo” is a new game launched in March this year. During the test, DLSS technology was turned on, and the average FPS was about 126:

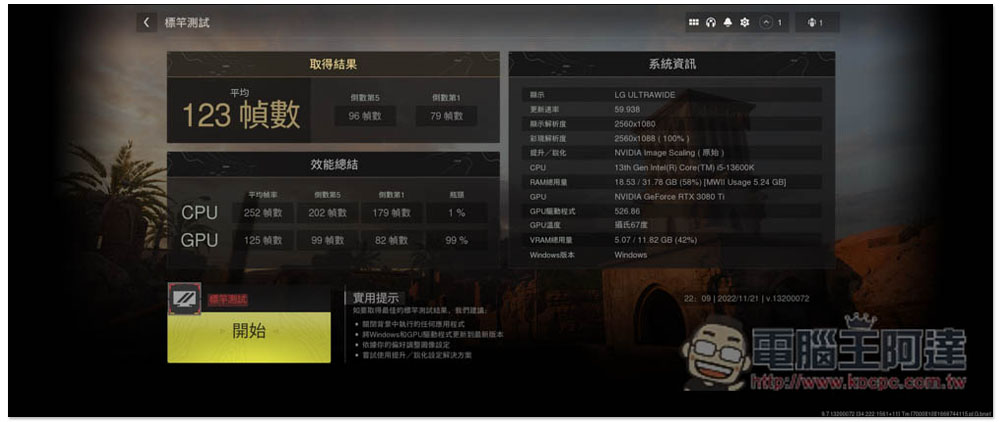
“Call of Duty: Modern Warfare II 2022” used the built-in benchmark test and measured an average score of 123 FPS. It is worth noting that the CPU bottleneck was measured in the performance summary section, which was only 1%, which was extremely low, but the GPU was already 99%:
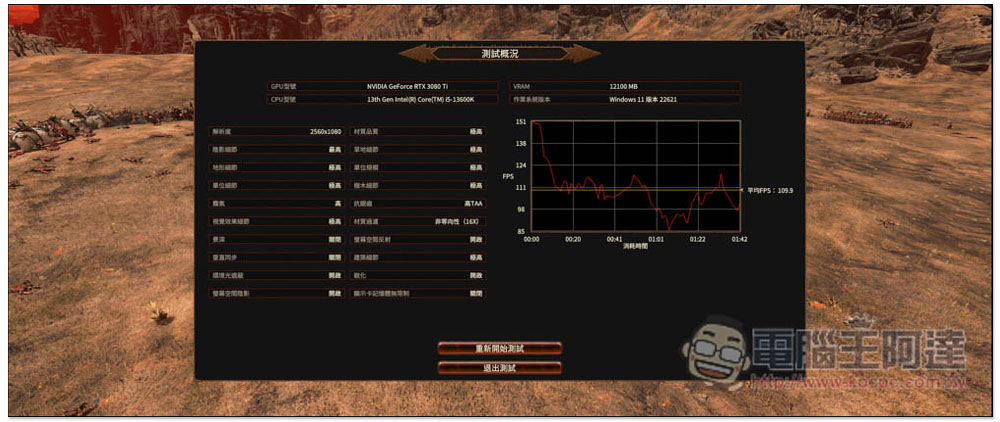
Total War: Warhammer 3’s Battle benchmark test mode achieved an average of 109.9 FPS:
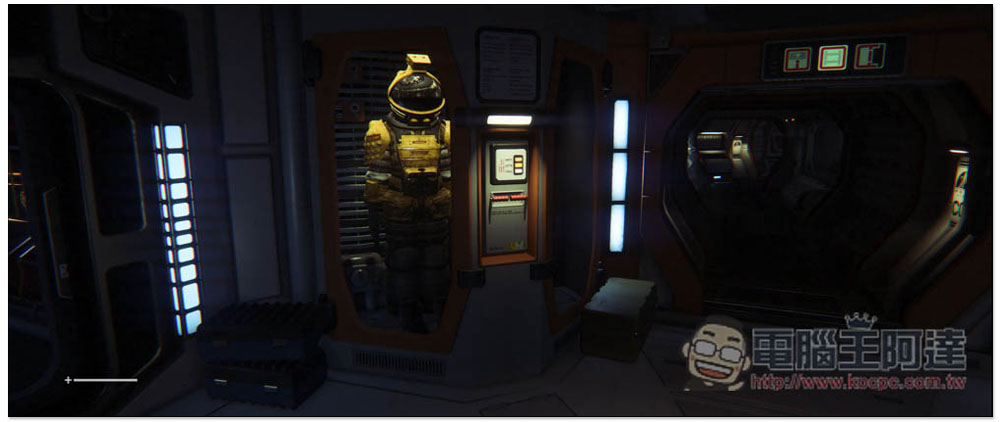
Alien: Isolation is super smooth, averaging 360 FPS:
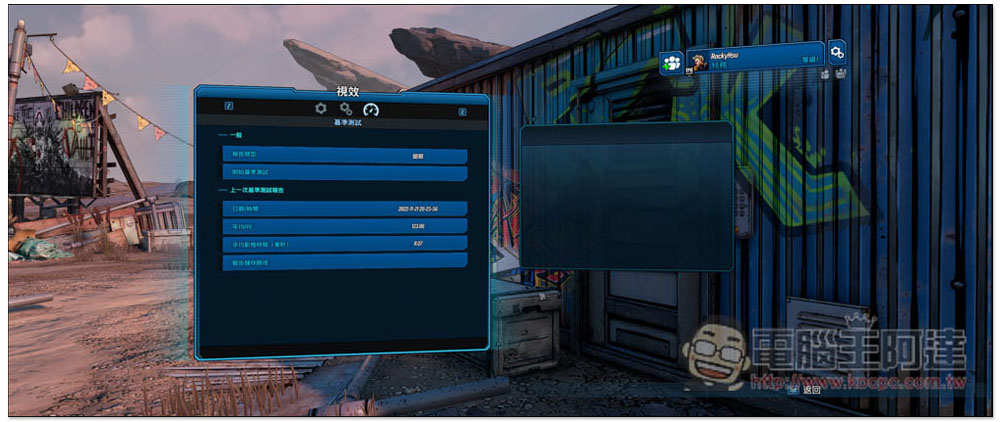
Borderlands 3 measured an average of 123.86 FPS using the built-in benchmark:
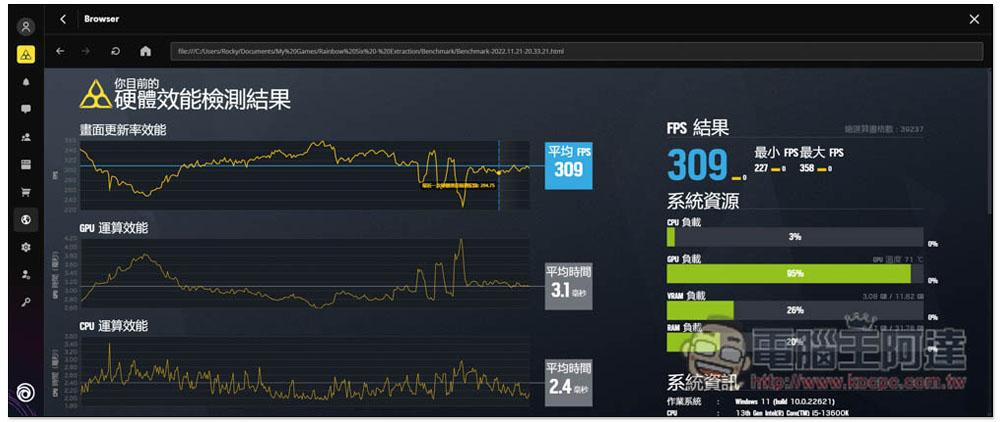
“Rainbow Six: Escape from the Zone” also used the built-in hardware performance test results and achieved 309 FPS, with a CPU load of only 3%:
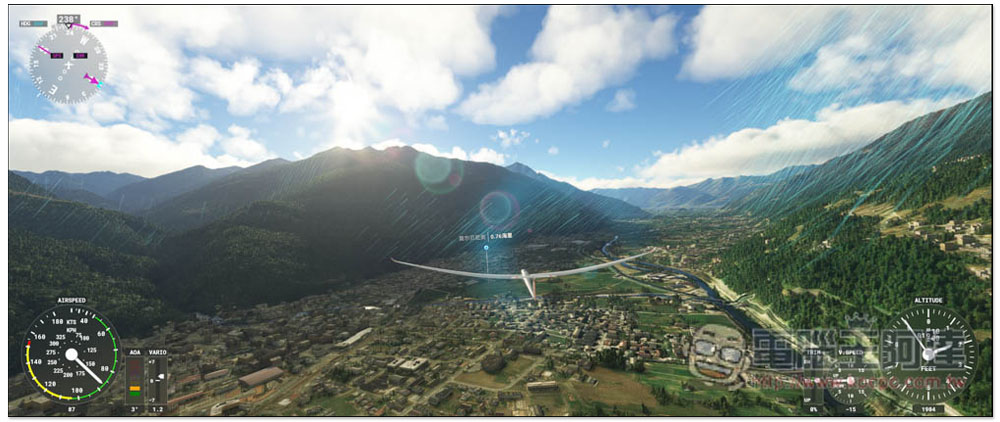
Microsoft Flight Simulator also averages 90 FPS:
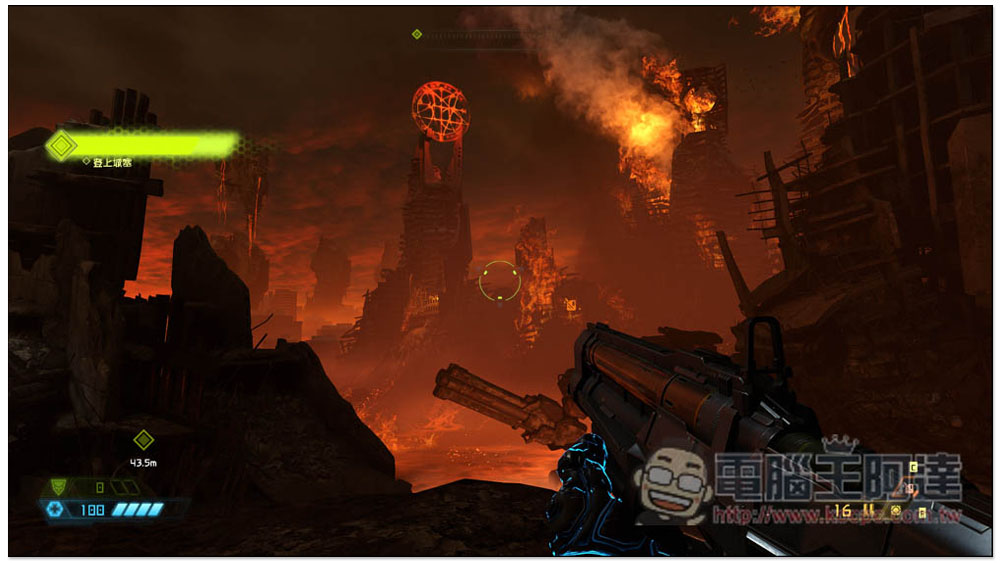
Doom Eternal was just as effortless, averaging 246 FPS:
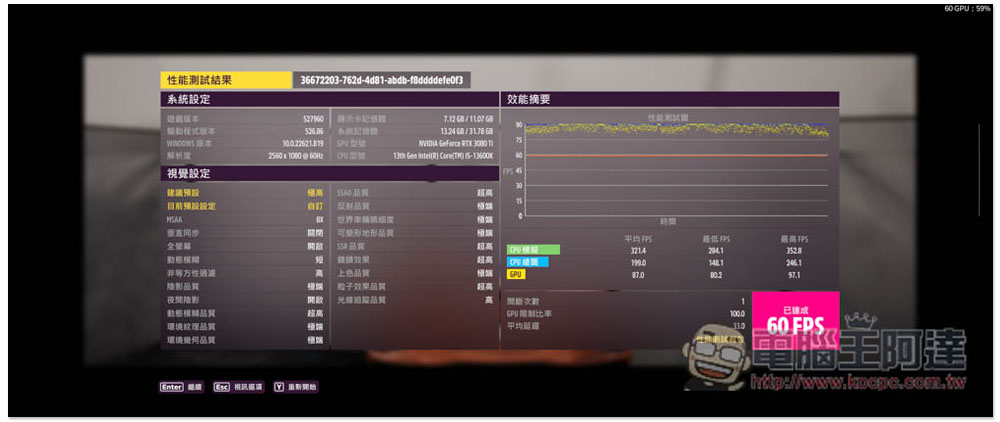
Finally, there is Forza Horizon 5, with an average CPU simulation FPS of 321.4 and a maximum of 352.8 FPS. The average FPS for CPU drawing is also 199, with a maximum of 246.1:
i5-13600K game measured results summary table:
| Game name | Average FPS |
| “Ghost Line: Tokyo” | 126 FPS |
| “Call of Duty: Modern Warfare II 2022” | 123 FPS |
| “Total War: Warhammer 3” | 109.9 FPS |
| “Alien: Isolation” | 360 FPS |
| “Borderland 3” | 123.86 FPS |
| “Rainbow Six: Evacuation from the Forbidden Zone” | 309 FPS |
| 《Microsoft Flight Simulator》 | 90 FPS |
| “Doom: Eternal” | 246 FPS |
| “Forza Horizon 5” | 321.4 FPS |
i5-13600K overclocking test
Since it is a K series, gamers who want to buy this machine will definitely want to squeeze out more performance through overclocking. If you don’t know how to overclock, it doesn’t matter. Intel provides a very easy-to-use “Intel Extreme Tuning Utility” with built-in one-click overclocking function. You don’t need to know how to adjust the voltage and clock. You can easily overclock with one click.
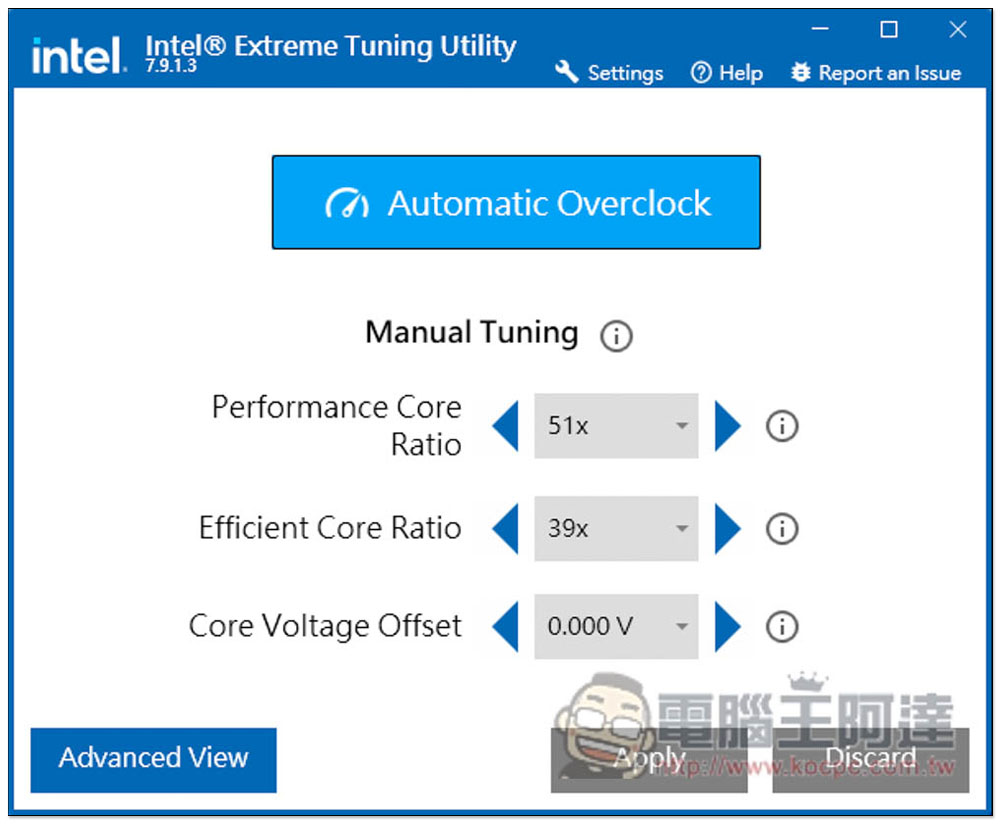
Intel Extreme Tuning Utility has two display interfaces. The picture below is the simple version, which provides three adjustment items. I prefer the Advanced View version because this interface also has a performance test function. After overclocking, you can know whether you have gained more performance:
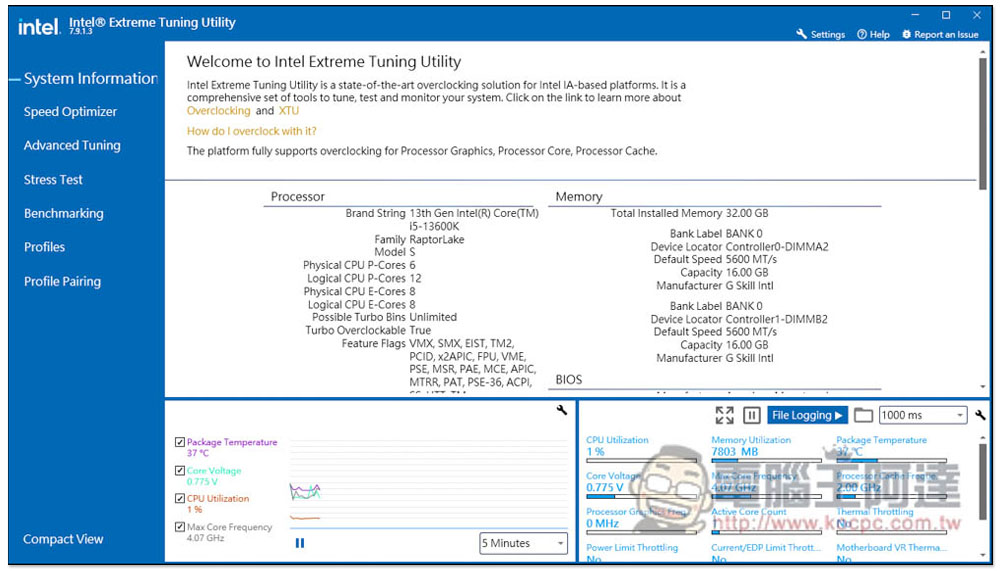
Advanced interface, Benchmarking is the performance testing function:
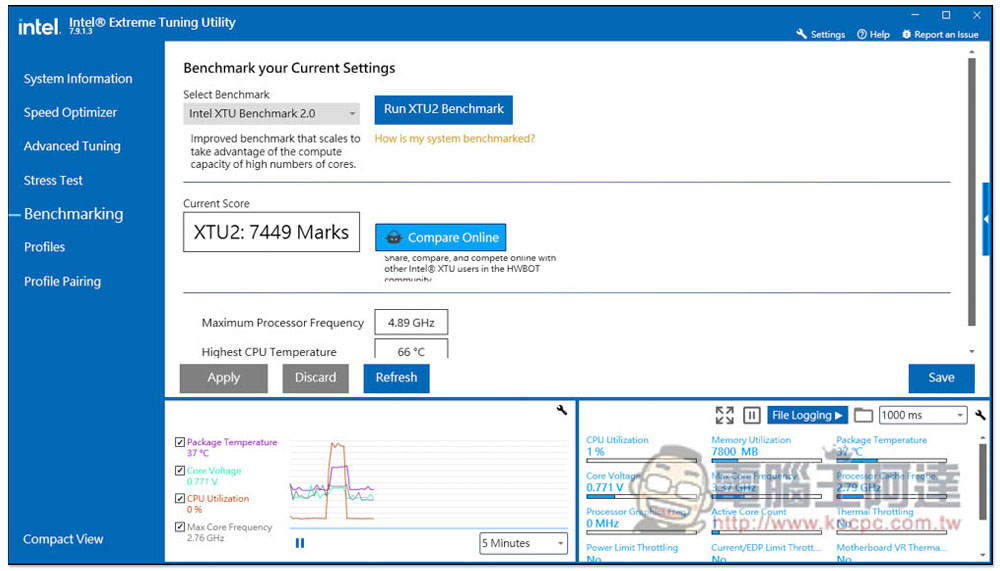
Before one-click overclocking, I also tested it first and got 7449Marks, with the highest clock speed being 4.89GHz:
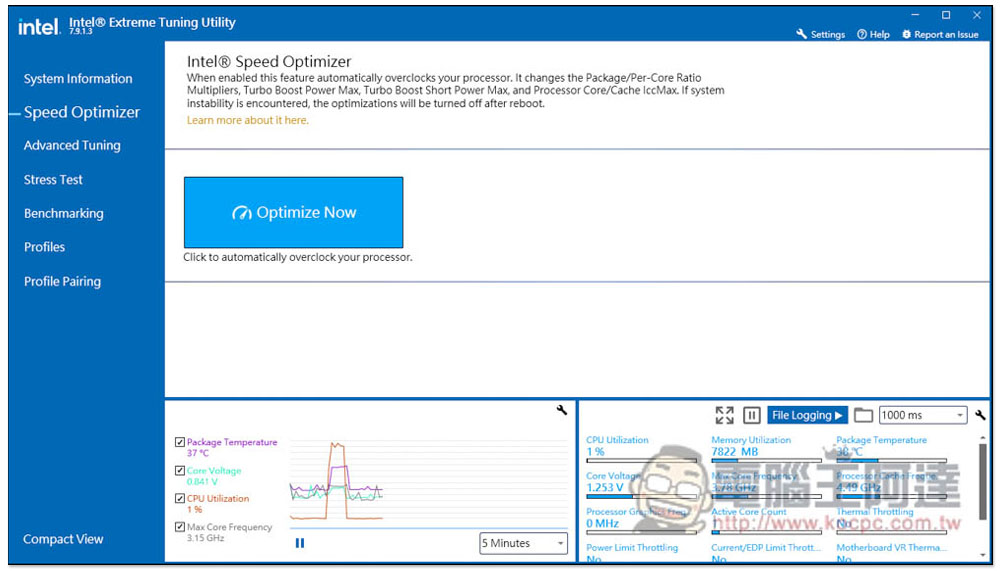
Go to Speed Optimizer and click Optimize Now, and overclocking will begin:
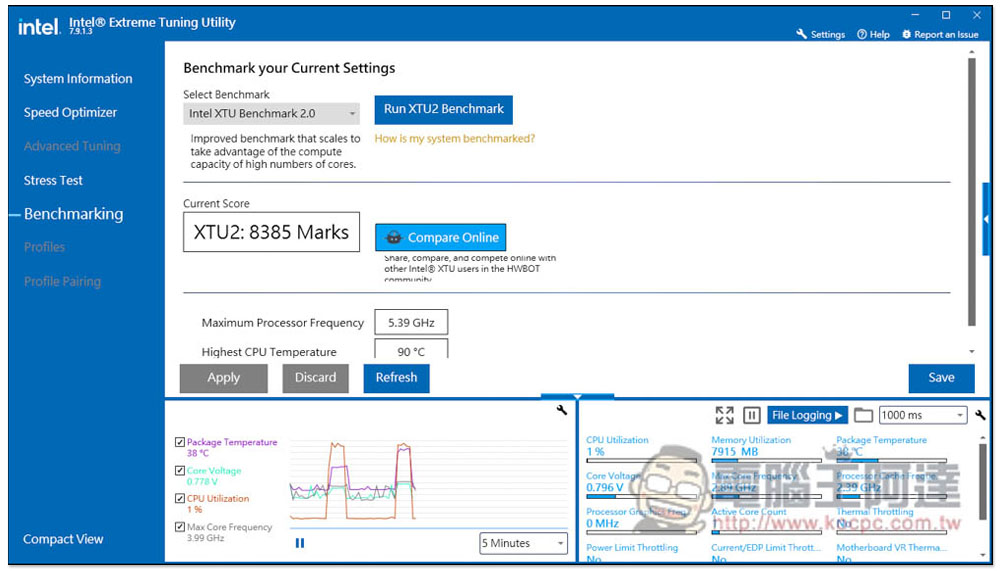
Then I tested again, and sure enough the score improved, getting 8385 Marks, and the maximum clock reached 5.39GHz:
Summarize
Not only is it a flagship processor, Raptor Lake’s new mid-range king i5-13600K is also quite satisfactory. This performance improvement is very good, especially for content creators. The multi-core performance has been increased so much, which can greatly improve work efficiency. Not only is the performance improved, the power consumption ratio is also better. It is worth considering for friends who plan to upgrade their computers.
Source: KOCPC Chinese