


I am still very impressed by the launch of Intel’s 12th generation last year. After changing to the hybrid architecture, the performance immediately improved greatly, and it was a very noticeable improvement. The 13th generation Raptor Lake also continues the same architecture, and the number of cores has been increased a lot. How much can the performance be increased? It’s quite curious. A while ago, I finally had the opportunity to test the most powerful gaming processor, the Intel® Core™ i9-13900K, and it did not disappoint. Both in terms of productivity and games, it surpassed the previous Intel® Core™ i9-12900K by a lot. I will introduce it to you in detail below.
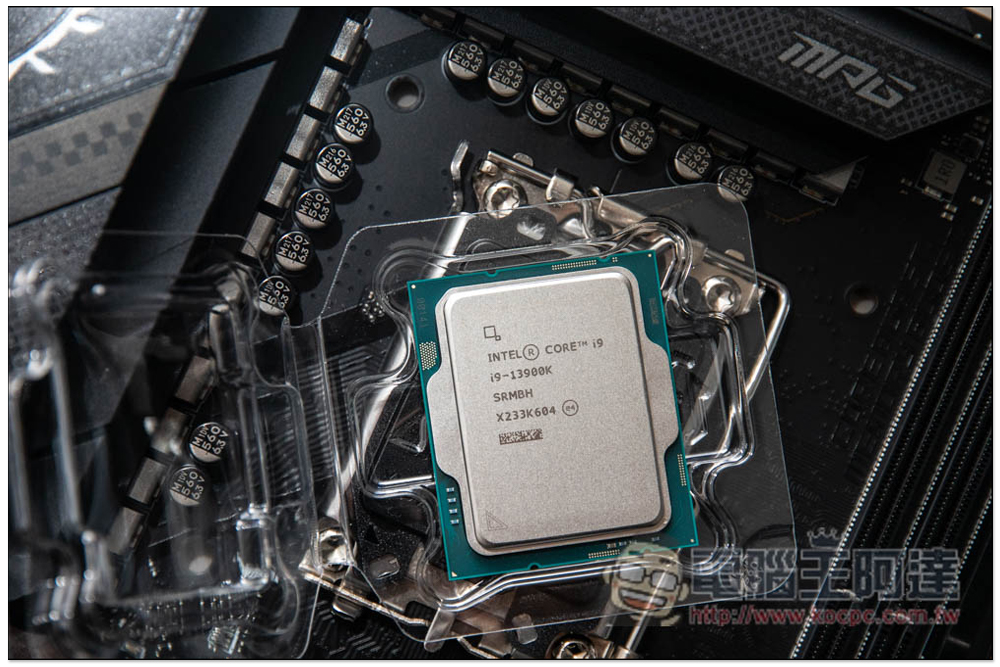
Raptor Lake vs. i9-13900K Specs Overview
Compared with the previous generation Alder Lake, the 13th generation Raptor Lake still maintains a hybrid architecture. This part has not changed much, but it has been enhanced a lot in details. For example, not only has the P-core cache been increased (each increased from 1.5MB to 2MB), but the number of E-cores has also become more, which means that for some multi-threaded tasks, such as: graphics calculation, compression/decompression, etc., the performance will be much higher than that of Alder Lake. In addition, the L3 cache memory (Intel Smart Cache) has also been increased from 30MB to 36MB:
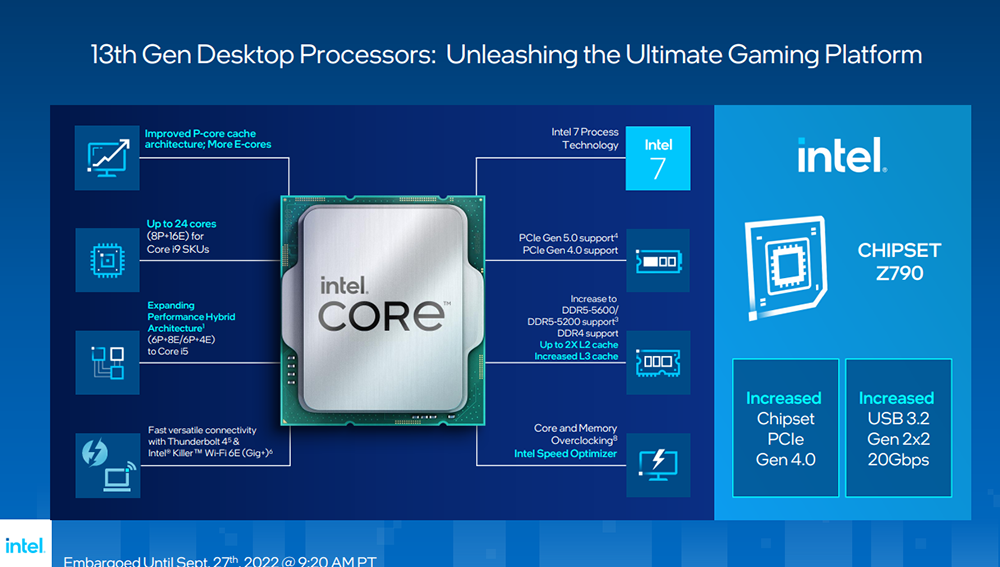
Another point worth noting is that Raptor Lake memory now supports up to DDR5-5600 specifications. Recently, memory has dropped like this. This is really a good time to buy it.
Below is a comparison of specifications between i9-12900K and i9-13900K
- The i9-12900K is equipped with 16 cores (8+8) and 24 threads, providing 30MB L3 cache and 14MB L2 cache. The P-core has a maximum clock speed of 5.1GHz, and the E-core is 3.9GHz. The base power consumption is 125W, and the maximum is 241W.
- i9-13900K is equipped with 24 cores (8+16), 32 threads, and provides 36MB L3 cache and 32MB L2 cache. The maximum clock speed of P-core can reach 5.8GHz, and the E-core is 4.3GHz. The base power consumption is 125W and the maximum is 253W.
Therefore, compared with the previous generation, the i9-13900K not only has an increased number of cores and threads, but also has larger L3 and L2 caches and a higher clock speed.
i9-13900K media test box quick unboxing
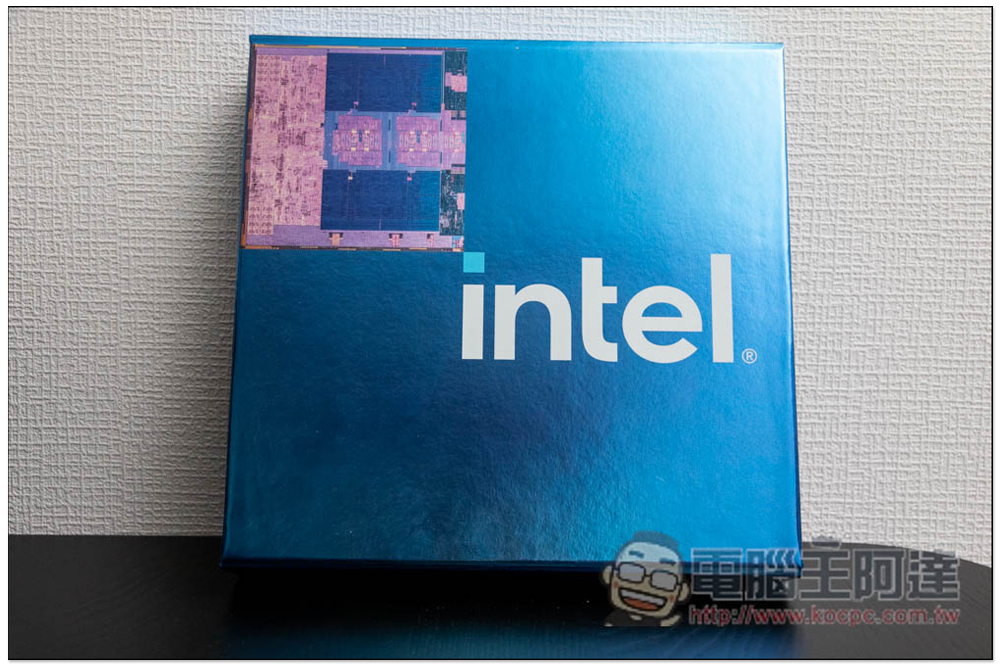
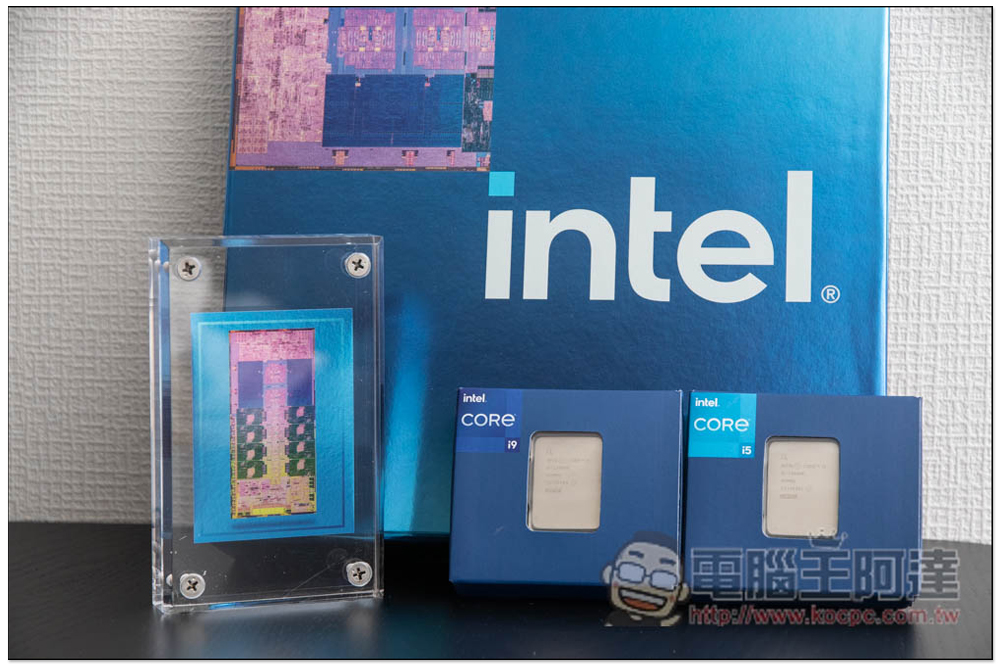
The test box provided by Intel for testing media is different from the commercially available version. It contains two processors, i9-13900K and i5-13600K, so the box is larger. The color of the outer box uses Intel’s brand blue, and there is a chip picture in the upper left corner:
The most surprising thing is that not only the processor, Intel also comes with a transparent stand with a chip image, which can be used for display:
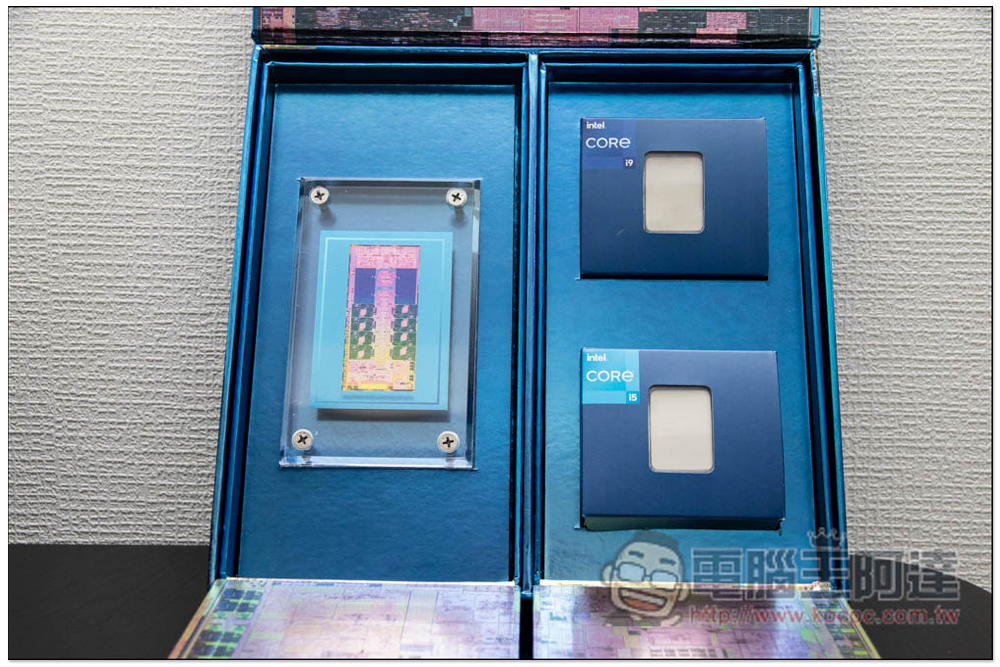
These two boxes are the i9-13900K, the most powerful gaming processor today, and the i5-13600K, the most powerful mid-range processor. We will write another review of the i5-13600K, and the main focus of this article is the i9-13900K.
i9-13900K test platform and performance measurement
Since it is currently the most powerful game processor, players and users who will buy this processor will basically have other hardware specifications that are not too bad. If you still don’t know how to choose, you can refer to our test platform. Regardless of productivity and 3A game masterpieces, the performance is very good, and the scalability, functionality, and heat dissipation are also great.
- Processor: Intel® Core™ i9-13900K
- Motherboard: MSI MPG Z790 CARBON WIFI
- Memory: G.SKILL TRIDENT Z5 DDR5-5600 16Gx2
- Hard drive: SPATIUM M480 PCIe 4.0 NVMe M.2 2TB
- Graphics card: EVGA GeForce RTX 3080 Ti
- Water cooling: Phanteks Glacier One 360MPH
- Power supply: Seasonic PRIME TX-1300
- Operating system: Windows 11 Pro 22H2
Many people may be worried about the heating condition of the i9-13900K. Basically, I would recommend using water cooling. For the Phanteks Glacier One 360MPH I am using, the standby state can be maintained between 35 and 45 degrees. The general working conditions are similar. When playing games, it can be kept at around 60 degrees, which is quite stable.
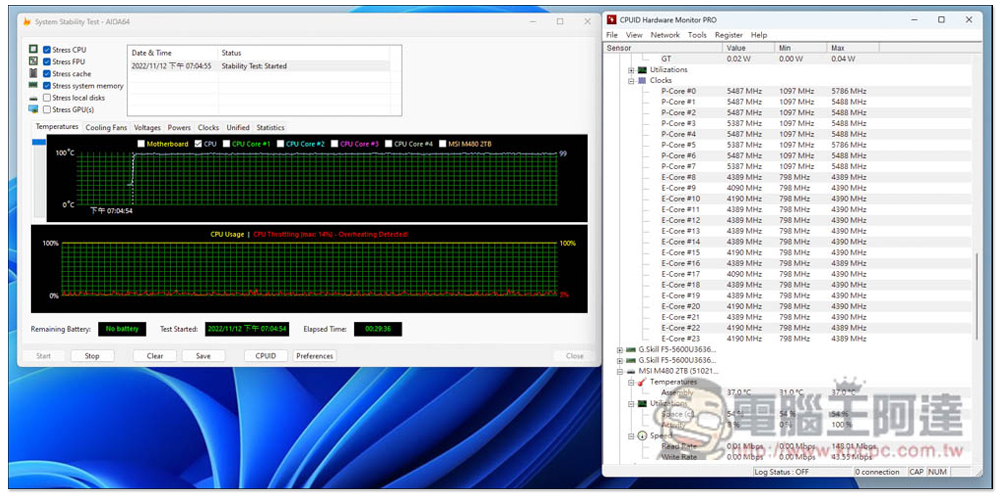
First, I conducted an AIDA64 stress test. The P-core is basically maintained at 5.5GHz. Some cores will slightly reduce the frequency when they hit 100 degrees, but the amplitude is not large, about 200MHz. E-core will slightly reduce the frequency at about 90 degrees, the same as about 200 MHz. The overall average power consumption is 248W, with a maximum of 258W. In terms of temperature, during the stress test, P-core hovered between 70 and 100 degrees. P-core 1 was the only one with the highest temperature of 97 degrees, and other P-cores all encountered 100 degrees:
With the increase in i9-13900K clock speed, the Geekbench 5 single-core score has also reached 2164, which is 13% higher than the previous generation. The multi-core is even more eye-catching, with a super high score of 23090, an increase of 29%:

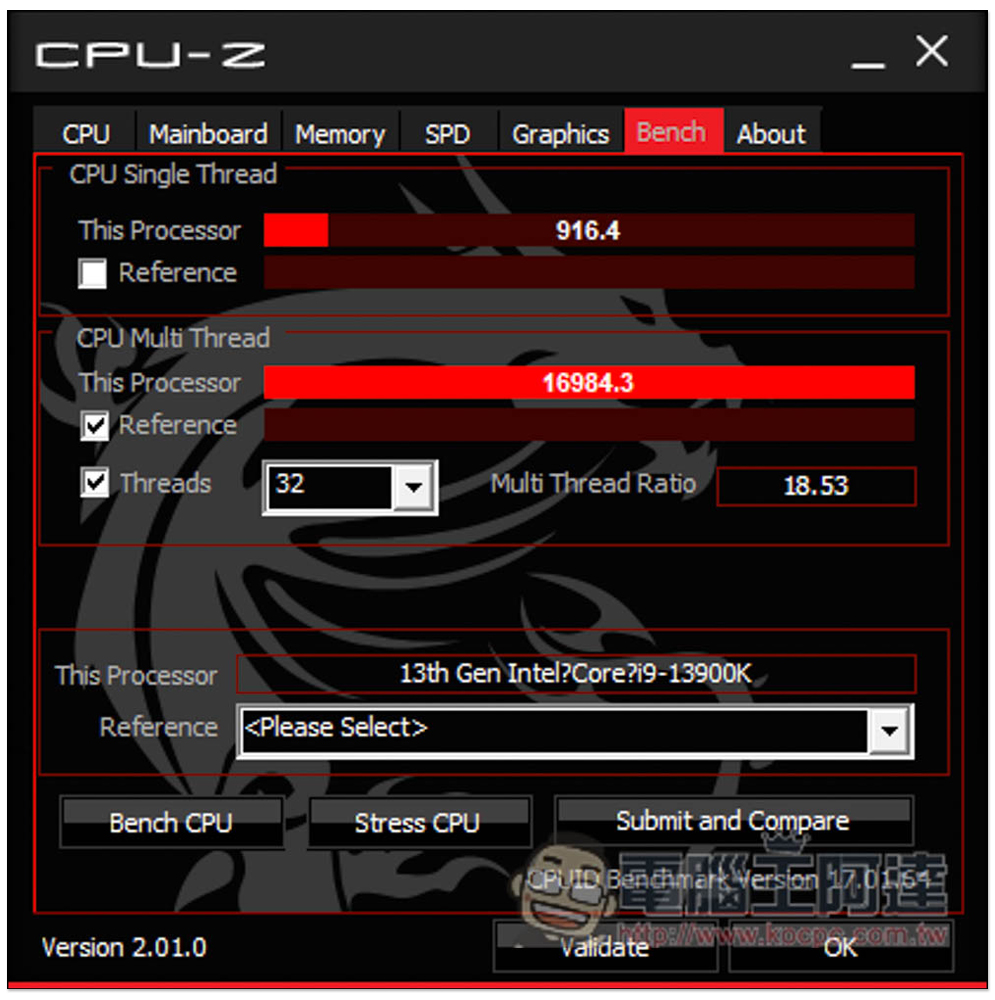
CPU-Z single thread is 916.4, multi-thread is 16984.3, an increase of 8% and 48% respectively. The multi-thread is really much worse:
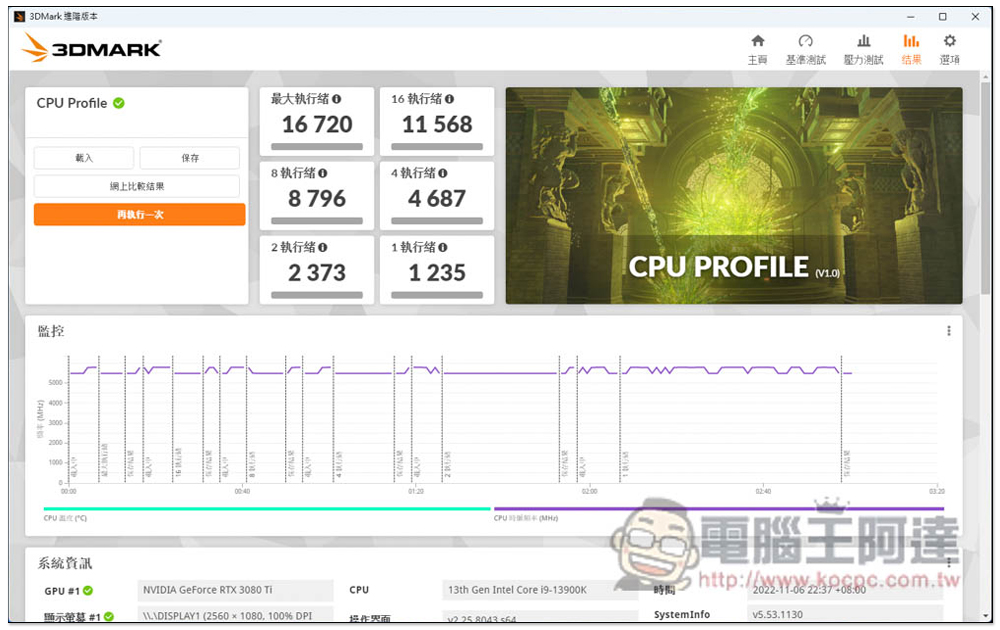
In the 3DMARK CPU Profile test mode, the maximum execution thread scored 16720 points:
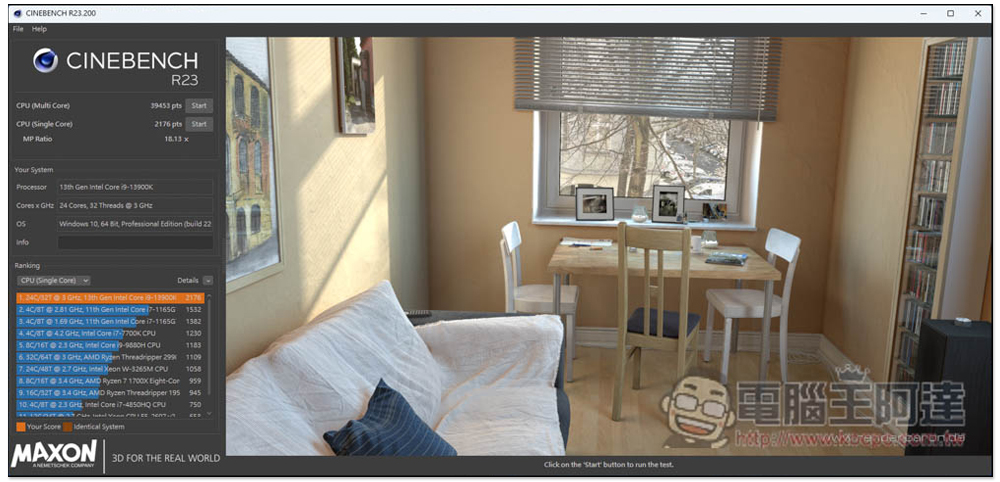
In the Cinebench R23 calculation test, the multi-core score was 39453 pts and the single-core score was 2176 pts. The multi-core part also improved a lot, which is 30% faster than the i9-12900K:
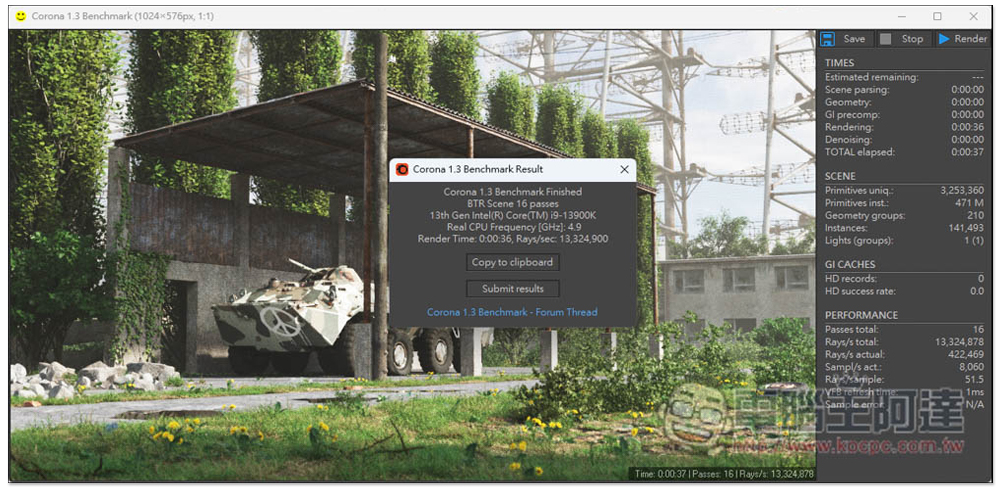
Corona Benchmark takes only 36 seconds to complete:
In the WinRAR compression benchmark test, i9-13900K also achieved a super high score of 55,301:

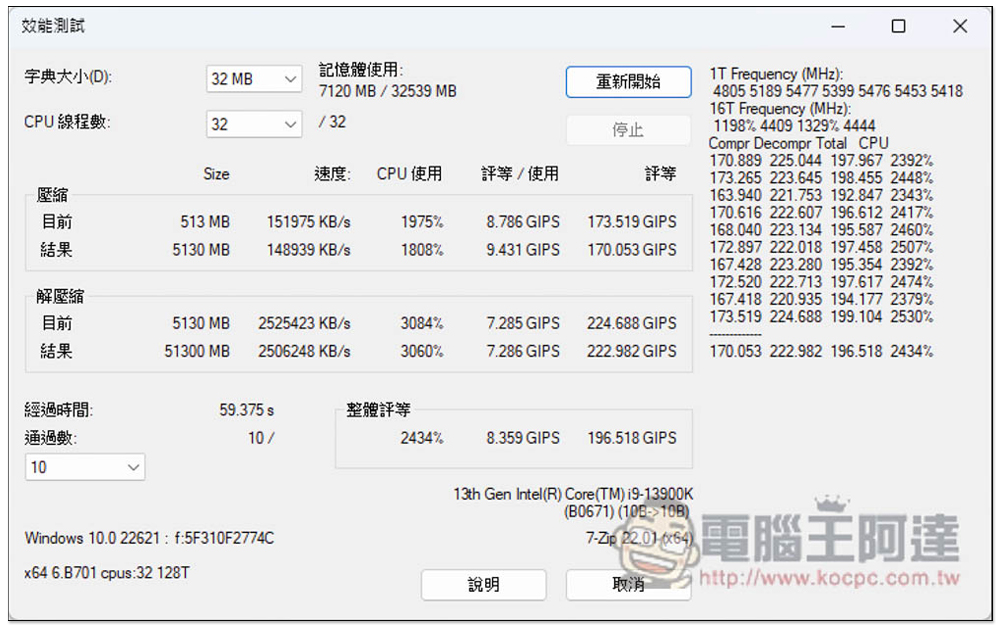
Another set of 7Zip compression test results, the overall rating was 196.518 GIPS:
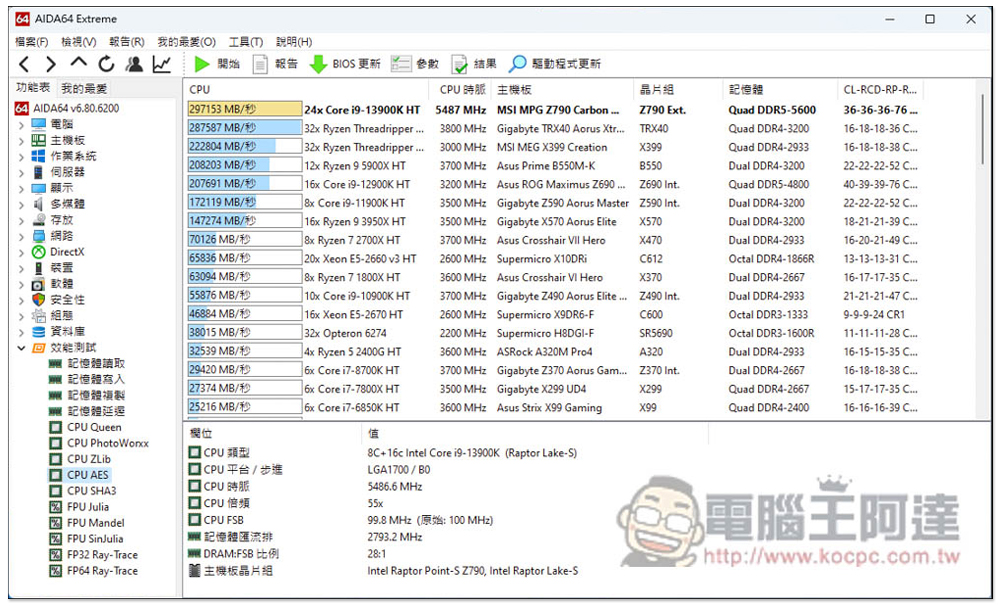
AES data encryption also took the first place in the current AIDA64 rankings, with a score of 297153MB/s:
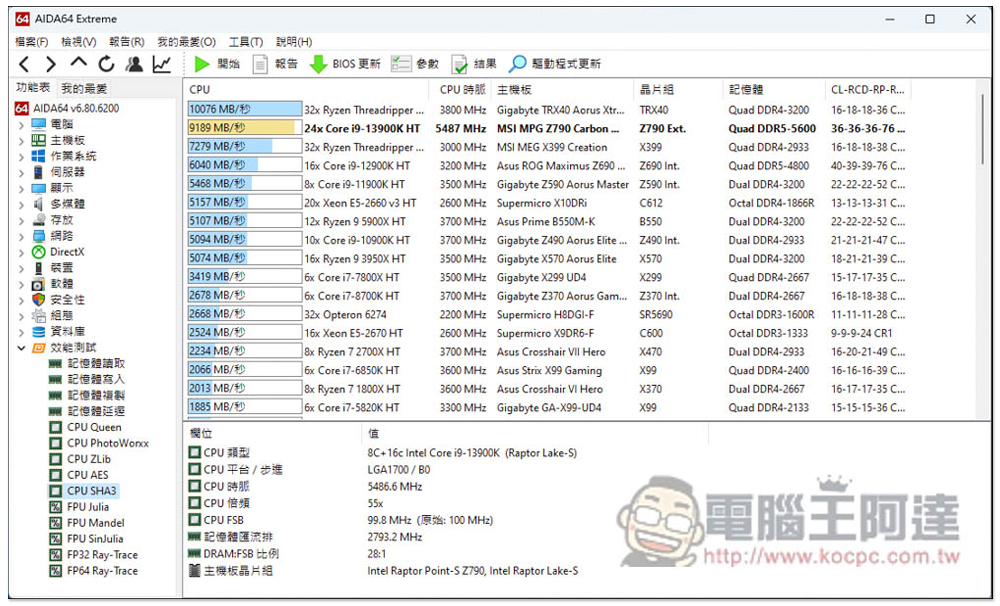
In the SHA3 secure hash algorithm test, i9-13900K also achieved a score of 9189MB/s, which is higher than i9-12900K’s 6040MB/s, which is quite a bit, an increase of up to 35%;
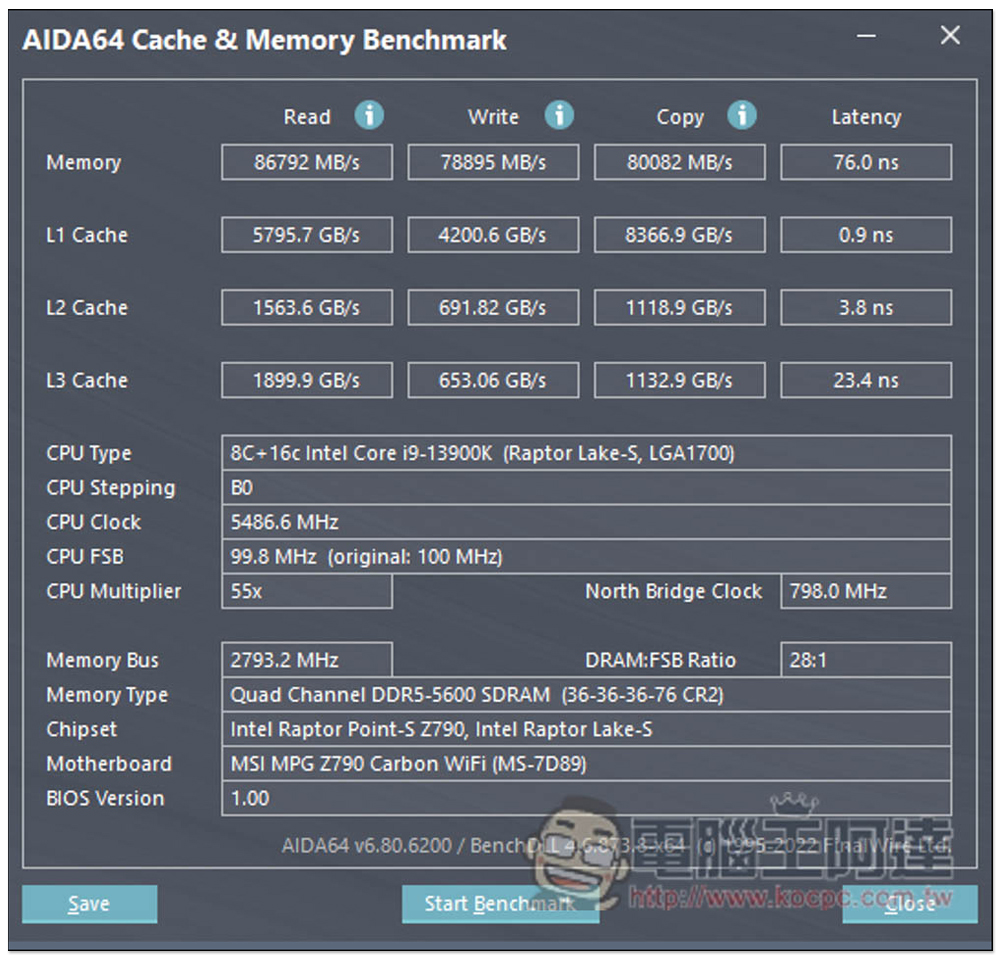
In the cache and memory tests, the DDR5-5600 memory is really powerful, with reading reaching 86792MB/s, writing 78895MB/s, and copying 80082MB/s. L1, L2 and L3 cache results are also quite high. For those who have budget, the first choice for Raptor Lake must be DDR5-5600, especially with the i9-13900K processor, which can achieve the ultimate performance in all aspects. Memory prices have also dropped a lot recently. If it is cheap, it is actually worth buying:
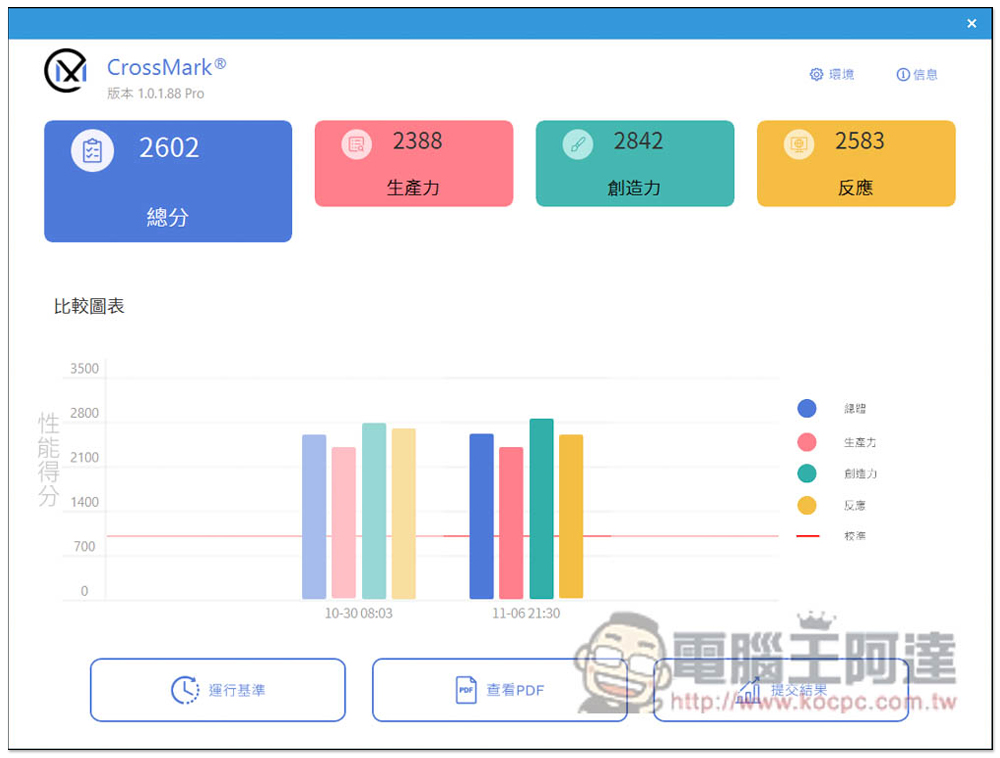
In terms of overall performance, let’s look at CrossMark first. The i9-13900K scored a total score of 2602. Whether it is productivity, creativity, or response, it is at least 10% higher than the previous generation:
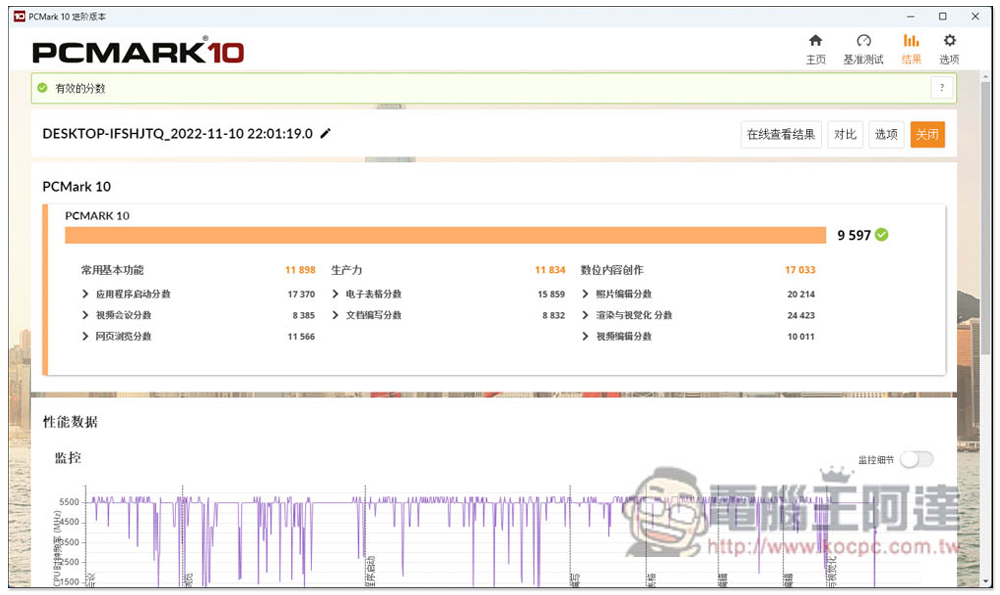
PCMARK 10 overall score is 9597:
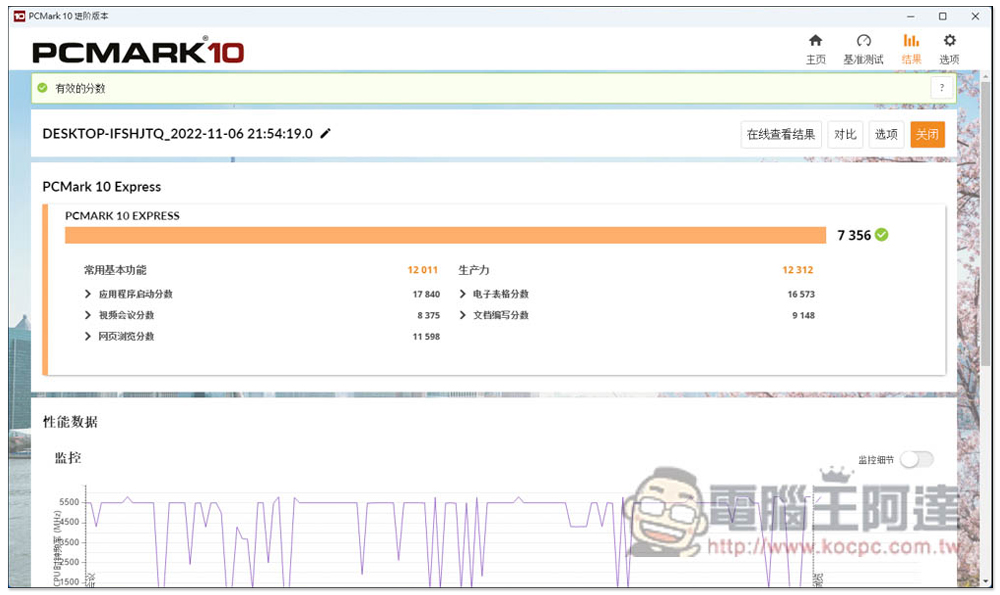
PCMARK 10 Express is 7356 points:
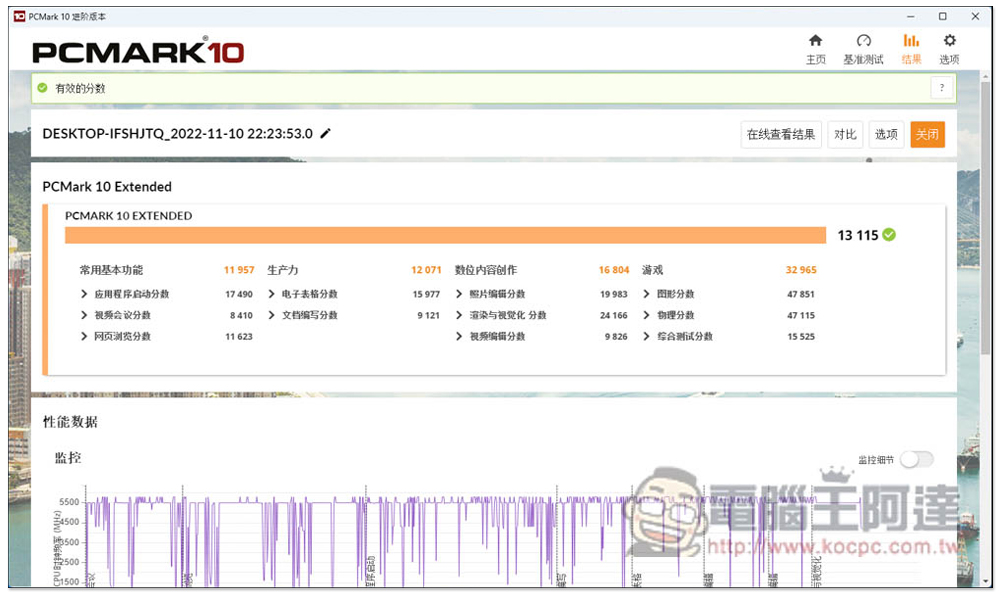
PCMARK 10 Extended is 13115 points:
WebXPRT4 score is 145 points:

Overall, even if the architecture of the i9-13900K has not changed, by upgrading the clock and adding cores, the performance in all aspects is much higher than the previous generation i9-12900K, especially the multi-core. This is really a plus for content creators, graphics and other tasks, greatly shortening work time and improving efficiency.
Performance score summary table:
| Test software | model | Score |
| Geekbench | single core | 2164 |
| multi-core | 2309 | |
| CPU-Z | single thread | 916.4 |
| multiple threads | 16984.3 | |
| 3DMARK CPU Profile | Maximum thread | 16720 |
| 16 execution threads | 11568 | |
| 8 execution threads | 8796 | |
| 4 execution threads | 4687 | |
| 2 execution threads | 2373 | |
| 1 thread | 1235 | |
| Cinebench R23 | multi-core | 39453 pts |
| single core | 2176 pts | |
| Corona | 36 seconds | |
| WinRAR | 55301 KB/s | |
| 7Zip | overall rating | 196.518 GIPS |
| AIDA64 AES | 297153 MB/s | |
| AIDA64 SHA3 | 9189 MB/s | |
| AIDA64 Memory | read | 86792 MB/s |
| write | 78895 MB/s | |
| clone | 80082 MB/s | |
| Delay | 76.0 ns | |
| AIDA64 L1 Cache | read | 5795.7 GB/s |
| write | 4200.6 GB/s | |
| clone | 8366.9 GB/s | |
| Delay | 0.9 ns | |
| AIDA64 L2 Cache | read | 1563.6 GB/s |
| write | 691.82 GB/s | |
| clone | 1118.9 GB/s | |
| Delay | 3.8 ns | |
| AIDA64 L3 Cache | read | 1899.9 GB/s |
| write | 653.06 GB/s | |
| clone | 1132.9 GB/s | |
| Delay | 23.4 ns | |
| CrossMark | total score | 2602 |
| productive forces | 2388 | |
| creativity | 2842 | |
| PCMARK 10 | 9597 | |
| PCMARK 10 Express | 7356 | |
| PCMARK 10 Extended | 13115 | |
| WebXPRT4 | 145 |
i9-13900K gaming test
And since it is called the most powerful game processor, players will definitely be curious about how the game performs? Although NVIDIA has launched RTX 4090 and RTX 4080 graphics cards, they are not cheap and difficult to buy. At this stage, the CP value of the RTX 30 series is actually higher, so this time we paired it with the RTX 3080 Ti graphics card, which is more in line with the current situation of most players.
The first is “Online: Tokyo”, which was only launched in March this year. This game supports DLSS technology. I turned it on during the test and adjusted all the image quality settings to the highest. The average FPS is about 130:

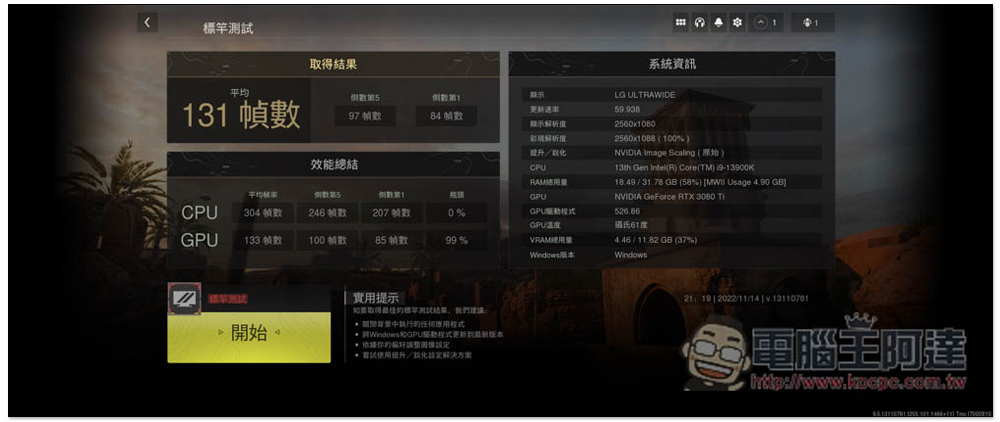
“Call of Duty: Modern Warfare II 2022” achieved an average score of 131 FPS. In addition, you can also notice the performance summary table. The average frame rate of the CPU has reached 304, with no bottleneck at all (0%), and the GPU has reached 99%:
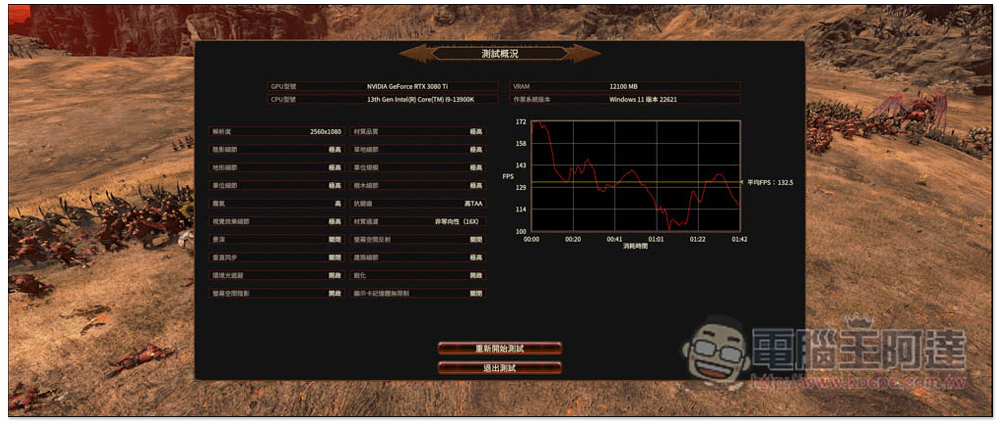
The Battle benchmark test mode of “Total War: Warhammer 3” achieved 132.5 FPS:
“Alien: Isolation” has no problem. The same picture quality is adjusted to the highest level, reaching an average of 370 FPS:
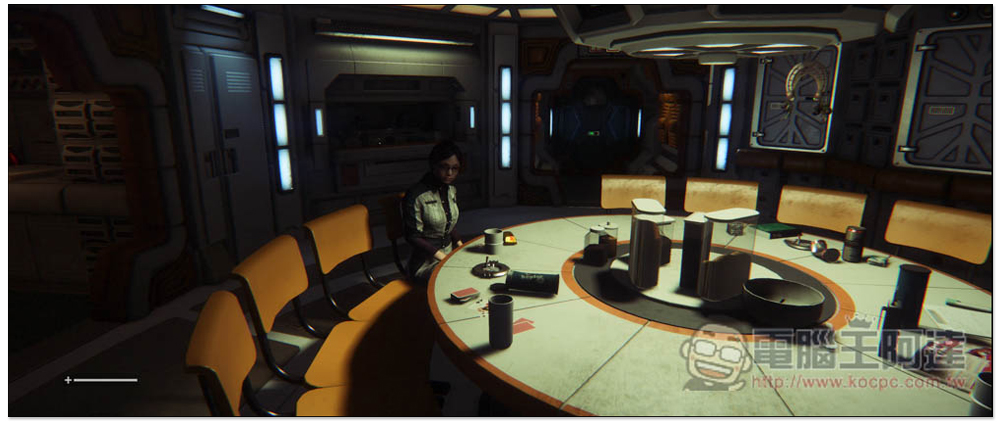
“Borderlands 3” uses the built-in benchmark test, and the performance is still very impressive, with an average FPS of 149.75:

“Rainbow Six: Evacuation from the Forbidden Zone” is also a 3A masterpiece just launched this year. Using the built-in hardware performance test results, it achieved a super high score of 222 FPS:
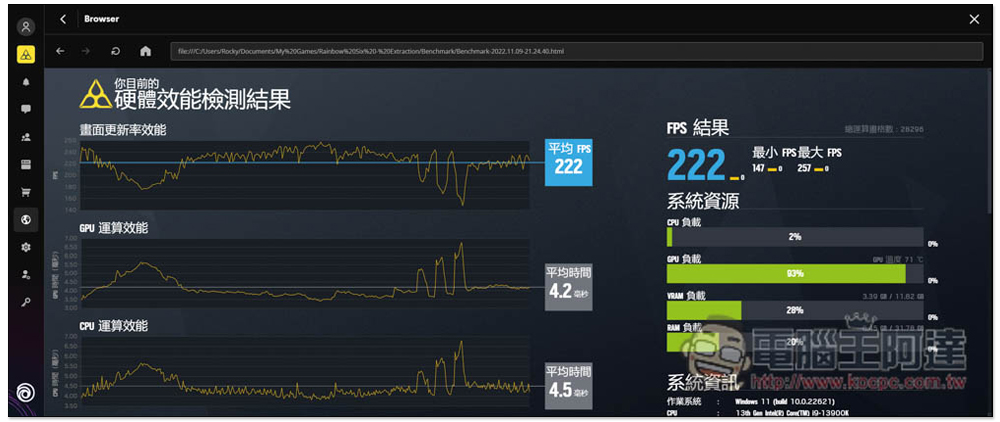
Microsoft Flight Simulator, which is quite performance-hungry, can reach an average FPS of 94:
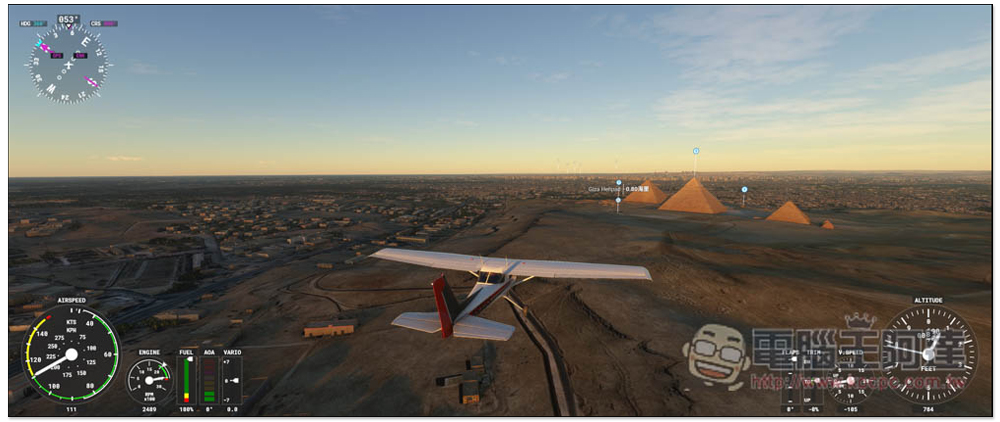
“Doom: Eternal” is also completely fine, maintaining an average performance of 250 FPS:
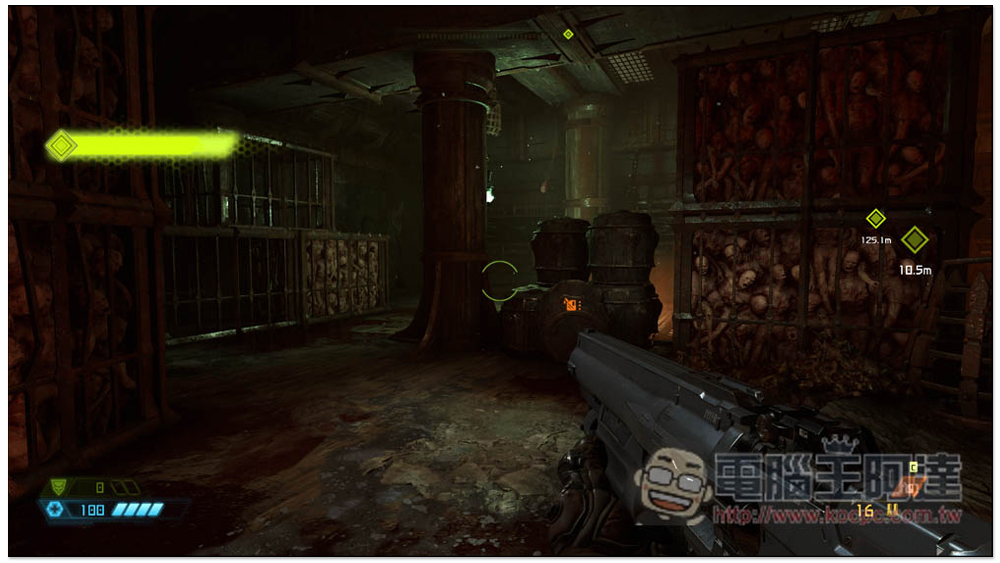
The average FPS of “Forza Horizon 5” is as high as 354.3, and the highest is 389.6 FPS:
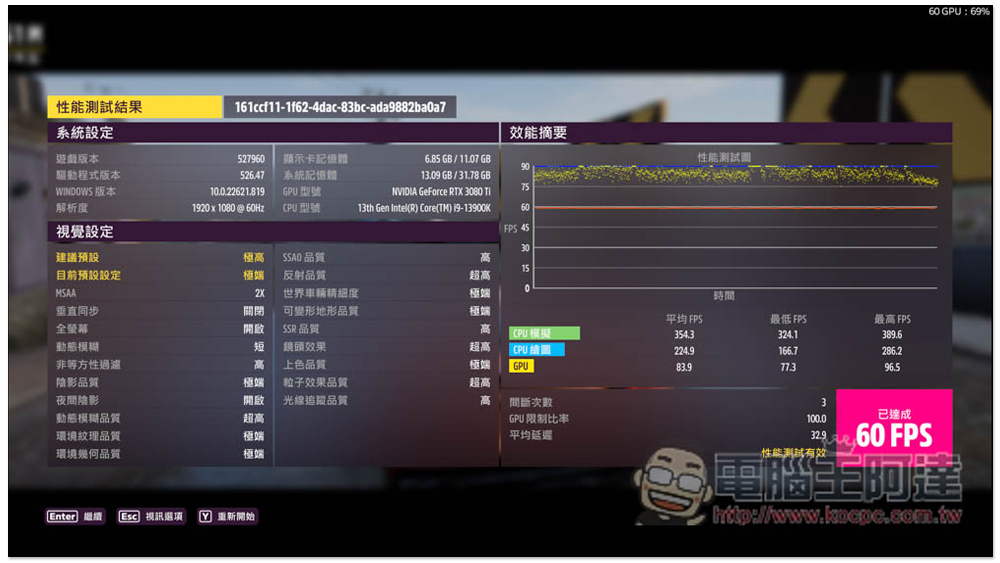
Comprehensive table of game actual test results:
| Game name | Average FPS |
| “Ghost Line: Tokyo” | 130 FPS |
| “Call of Duty: Modern Warfare II 2022” | 131 FPS |
| “Total War: Warhammer 3” | 132.5 FPS |
| “Alien: Isolation” | 370 FPS |
| “Borderland 3” | 149.75 FPS |
| “Rainbow Six: Evacuation from the Forbidden Zone” | 222 FPS |
| 《Microsoft Flight Simulator》 | 94 FPS |
| “Doom: Eternal” | 250 FPS |
| “Forza Horizon 5” | 354.3 FPS |
i9-13900K overclocking actual measurement
For those who know a little bit about Raptor Lake, you should have heard that this overclocking is even better. Previously, overclockers even broke world records. Since you have bought such a powerful processor, you will definitely want to squeeze out more performance. Here we use the official Intel® Extreme Tuning Utility (Intel® XTU) software to see how much additional performance you can get by overclocking in the safest and most stable way.
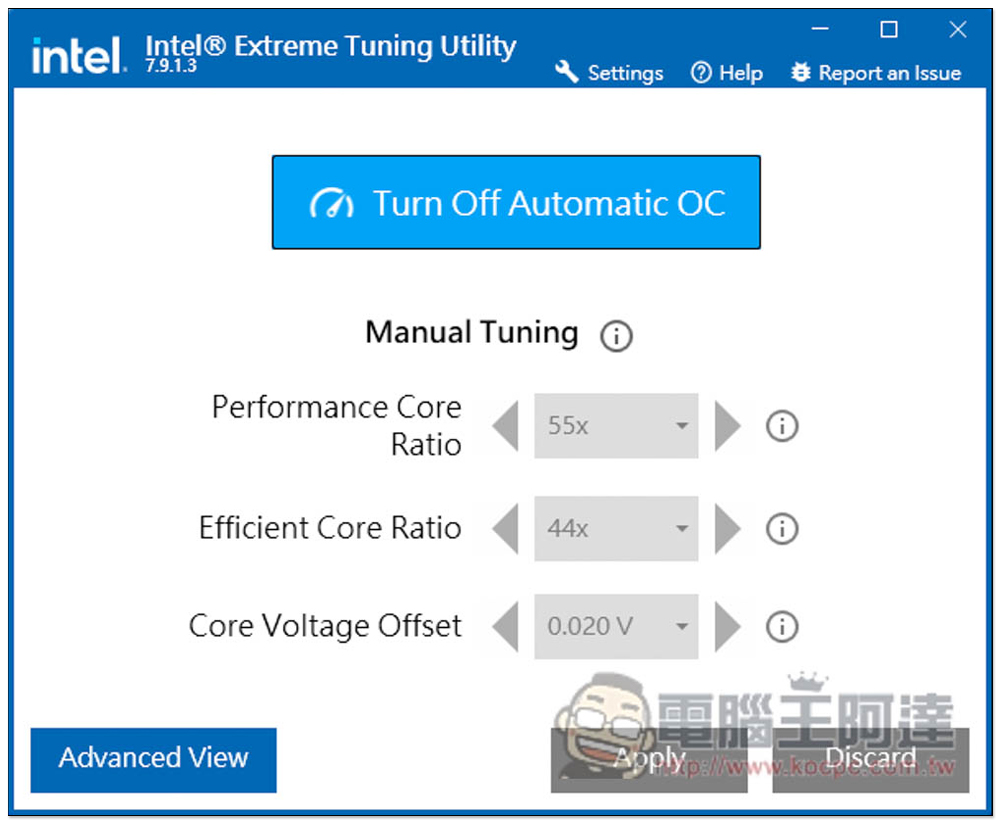
Intel® Extreme Tuning Utility provides two modes. The easy mode is opened at the beginning and has a one-click overclocking function. There are also manual adjustment settings for the multiplier and operating voltage of the P-core and E-core cores below:
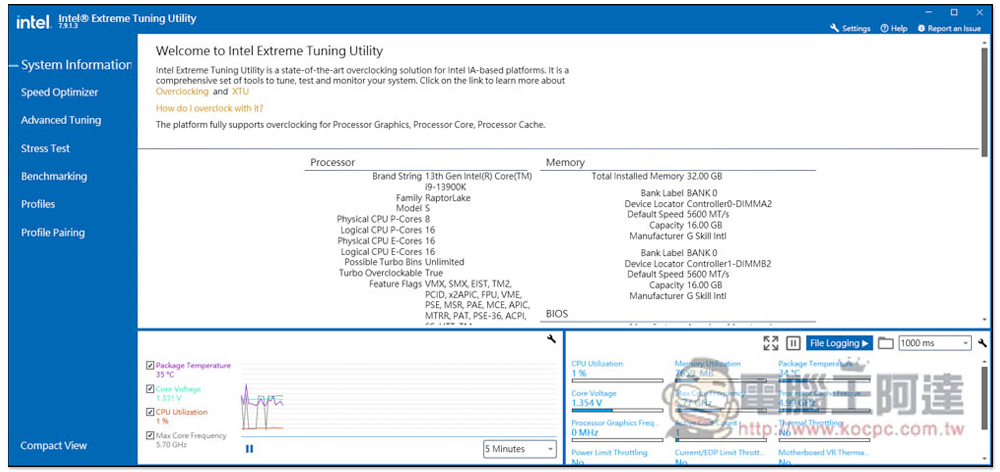
Click Advanced View to enter the advanced mode interface, where there are more information, functions, and adjustment settings, depending on which one you like to use. The advanced mode provides performance testing function (Benchmarking), so I use this mode:
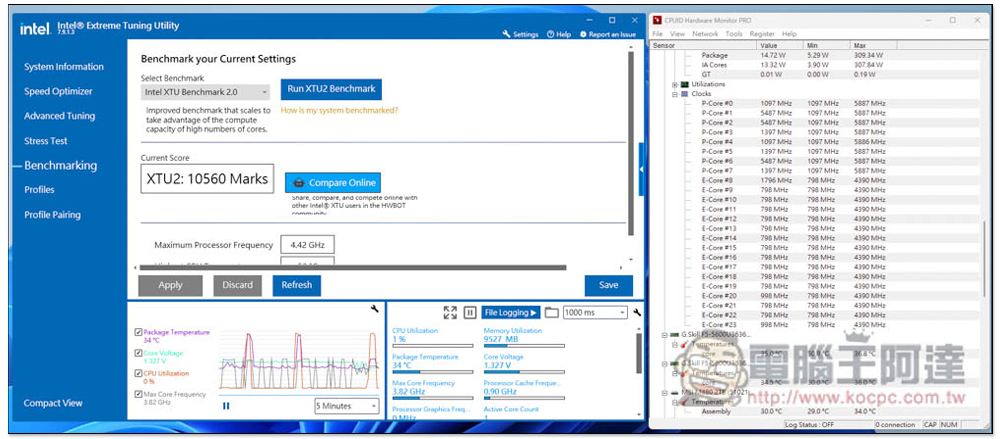
Go to Benchmarking and click Run XTU2 Benchmark to start testing the current performance. Wait for a few minutes and the program will be displayed below. 10560 Marks will be obtained before overclocking. Most of the P-core cores maintain low clock speeds (1GHz~2GHz) during standby, and the E-core is no exception, all running between 700~1000 MHz:
Then I went into Speed Optimizer to enable overclocking:
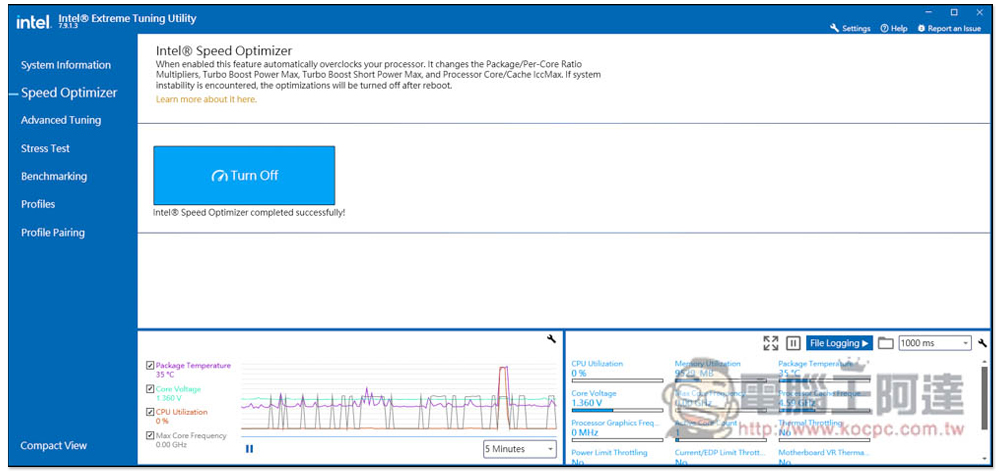
Tested again, the score became 13255 Marks, and the performance increased by 25%, which is a huge difference. All P-core cores will remain above 5.5GHz, and 2 will reach 5.8GHz. All E-core cores have also been increased to 4.4GHz:
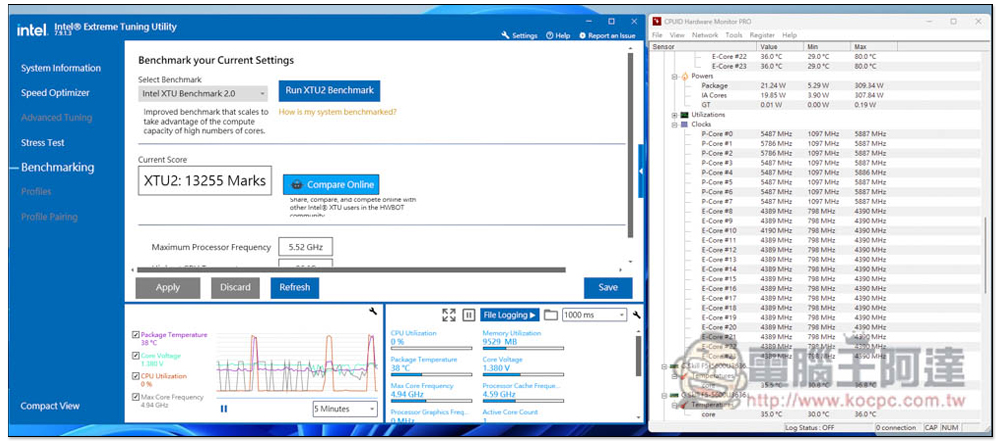
This also means that through the official one-click overclocking function, you can easily gain an additional 25% performance. Of course, the cooling solution used by the processor should not be too bad, so that it can run stably for a long time after overclocking.
In addition to Intel® Extreme Tuning Utility, motherboard manufacturers now also provide one-click overclocking functions that can achieve the same effect, such as MSI Center’s extreme mode:

Summarize
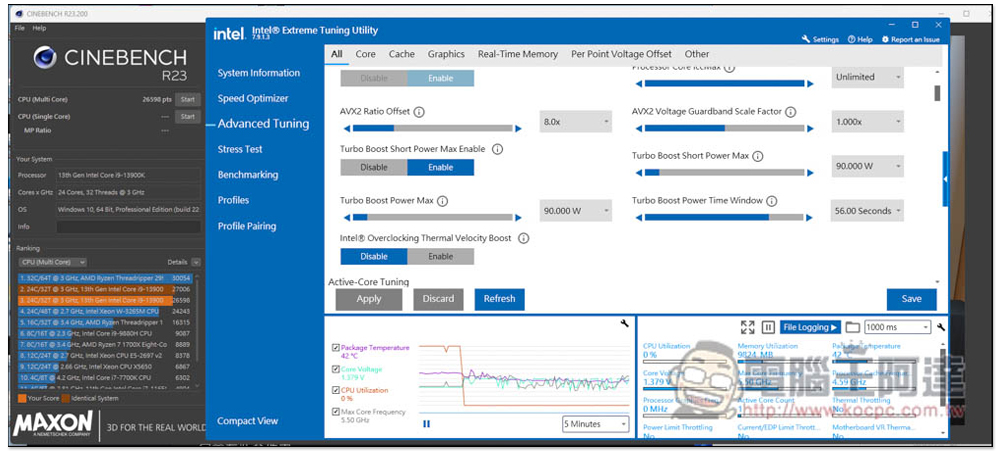
Just as expected, the i9-13900K did not disappoint at all. Even though the architecture has not changed much, it still improves a lot in terms of performance. Multi-core is the most obvious, and the power consumption ratio is also better. It only requires 85W of power consumption to achieve the same performance as the i9-12900K.
The Cinebench R23 multi-core score of i9-12900K is 26227 points. I used Intel® Extreme Tuning Utility to limit the power consumption of i9-13900K to 90W, and Cinebench R23 was able to run a higher score of 26598 points:
Source: KOCPC Chinese