


The 2020 presidential election has ended. Although we all know who won, how many votes he got, and the percentage of votes cast, most people will be curious about their household registration and the neighborhood they live in. Who they voted for can be found quickly, and this “Instant Voting Map” network allows you to quickly find out, even in the village. In addition, comparative data with 2016 and 2018 are also provided, making it easy to know where the big turnaround has been.
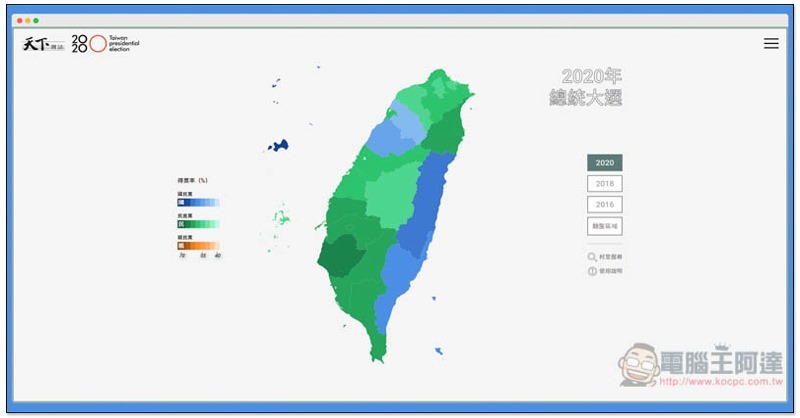
Real-time voting map. With one click, you can check your household registration, where you live, who has the highest presidential vote rate, and which places have made a comeback compared with 2018.
This real-time voting map was produced by Tianxia Magazine. The voting data are all from the winning election committee, so it is very accurate.
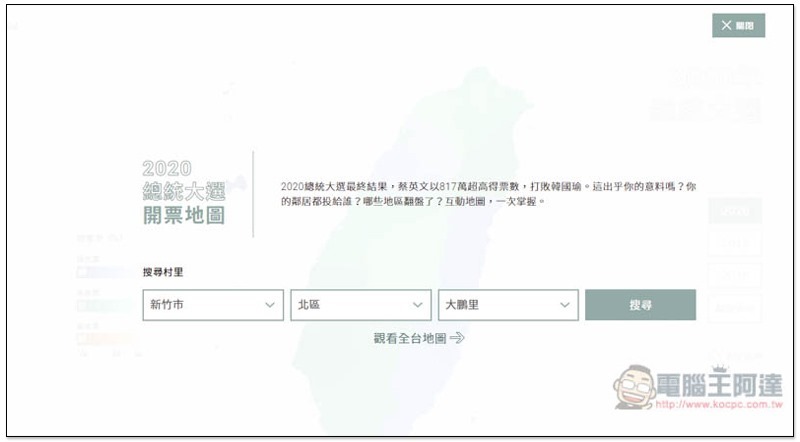
Click me to enterAfter viewing the instant ticketing map, you can select the conditions you want to search for, including which city, region, and village. You can also click Close in the upper right corner to see the vote rate in Taiwan as a whole:
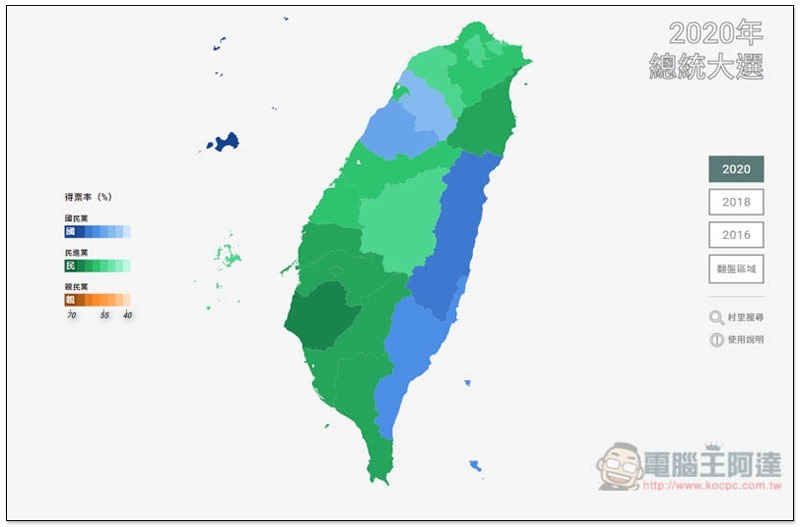
The darker the color, the higher the vote rate for the presidential candidate. On the right, you can switch between 2018 and 2016 (2018 is the nine-in-one general election data):
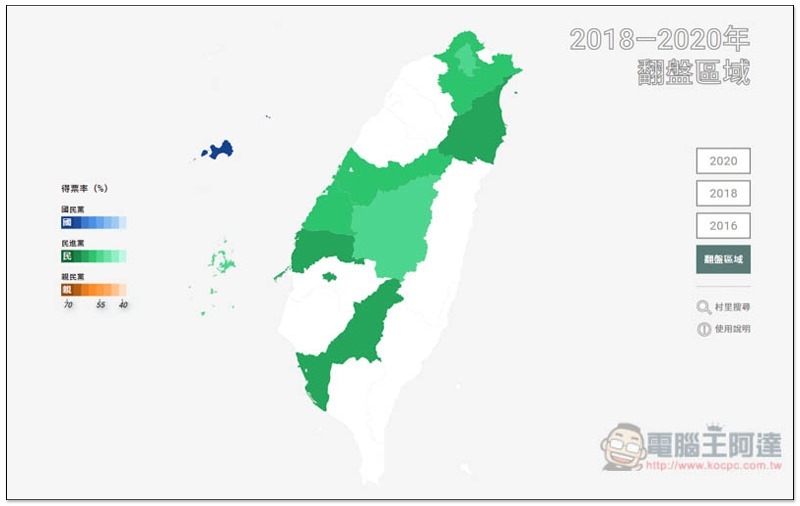
There is also a comeback area, where you can quickly know which places had the biggest comebacks compared to the 2018 nine-in-one general election, which originally had a majority of blue votes, but this time they all turned into green votes. Yilan, Yunlin, and Kaohsiung had the biggest comebacks:
Let me take Liujiajie, Xinyi District, Taipei City as an example:
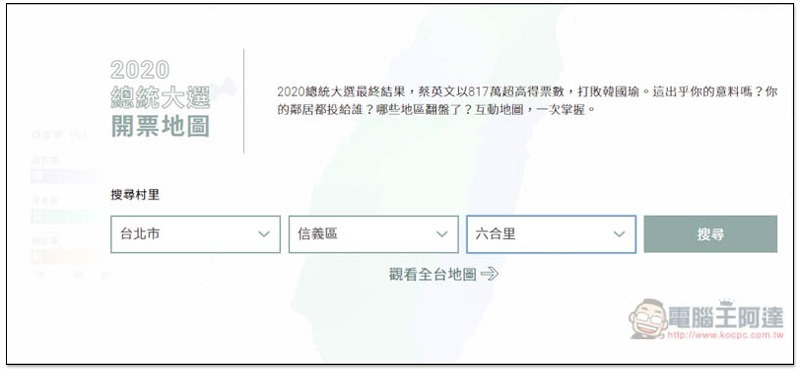
After pressing search, the screen will display the vote share of each presidential candidate in the six reasonable parties. It will also record which party won in the past. From 2016 to 2020, it was the KMT, and the percentage has an increasing trend:
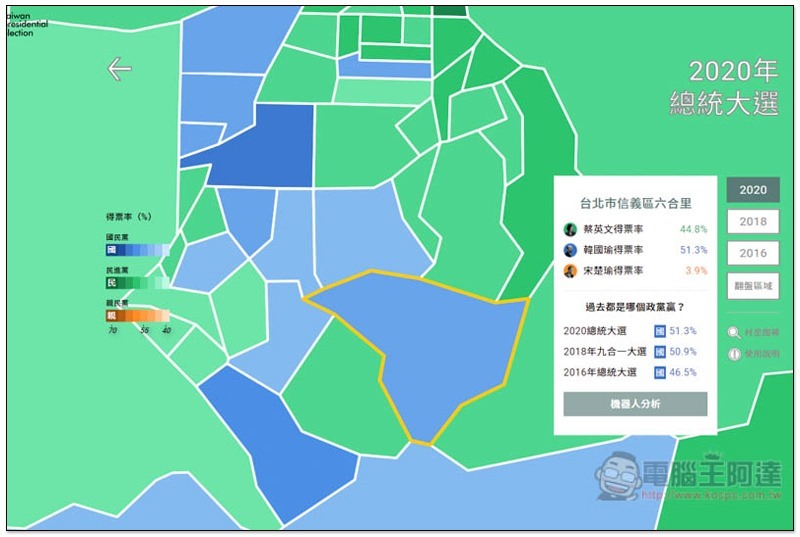
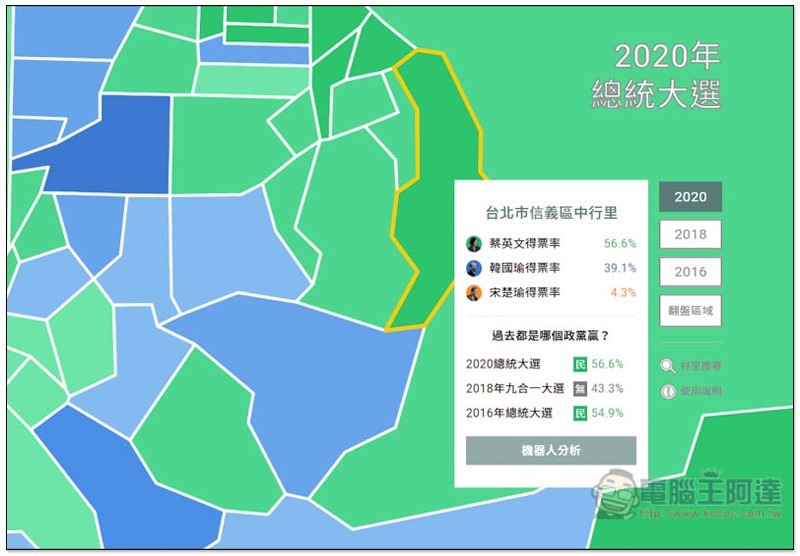
You can also click on the area next to it to check the vote rate. Taipei City can be said to be half blue and half green:
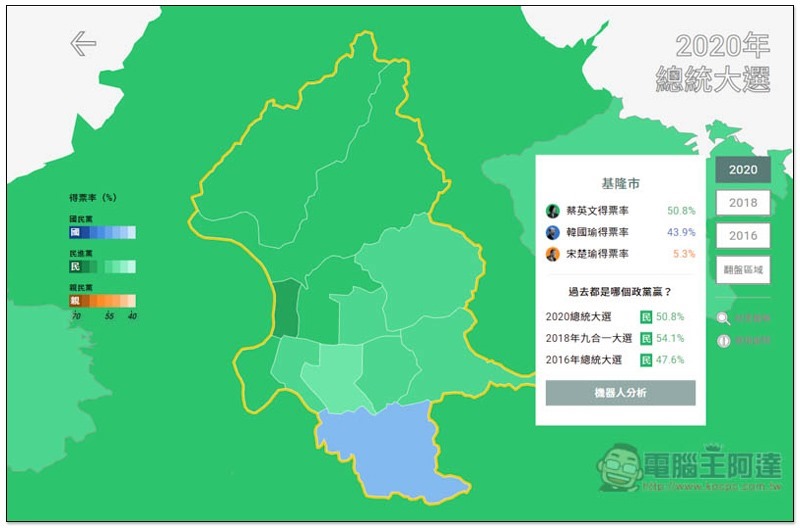
In addition to the village, you can also look at the vote share of the entire city. In the case of Keelung City, green has won from the past to this time. However, compared with the nine-in-one general election, the percentage of green has dropped a bit:
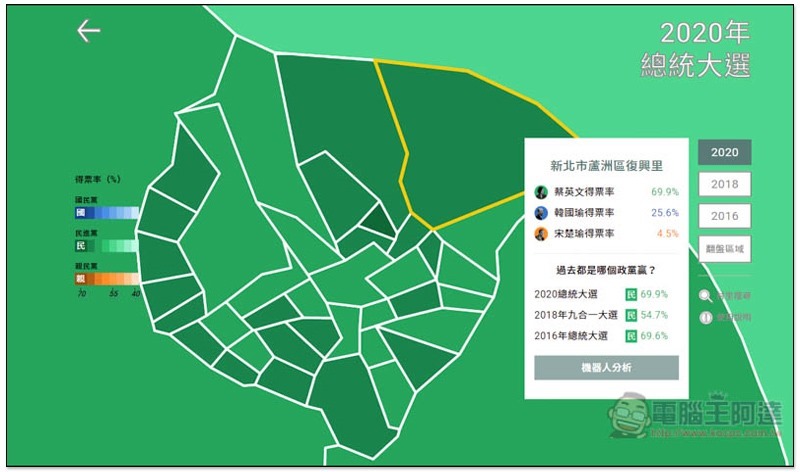
Luzhou District in New Taipei City can be said to be a big green vote bank. The gap in almost every village is very large:
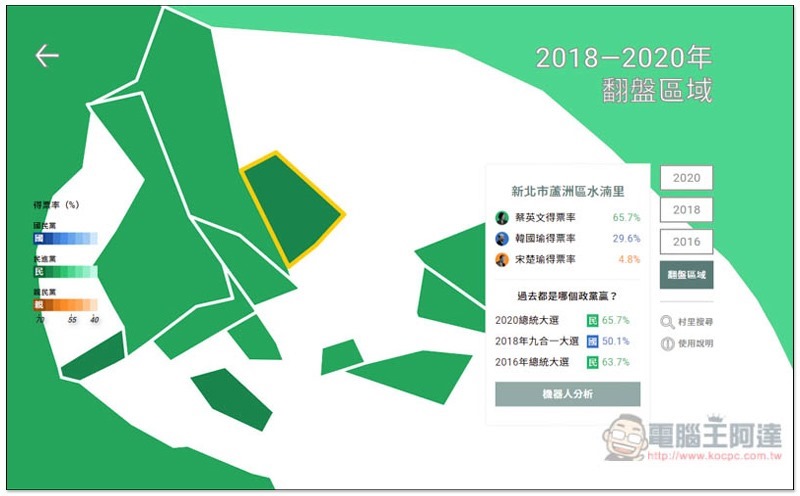
Turnaround area compared to 2018, white means no:
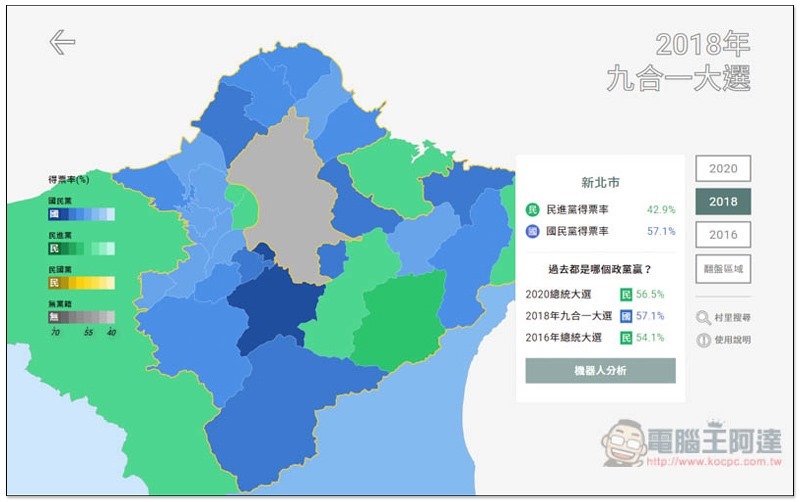
You can also view the historical vote distribution status of the 2018 nine-in-one general election and the 2016 presidential election separately:
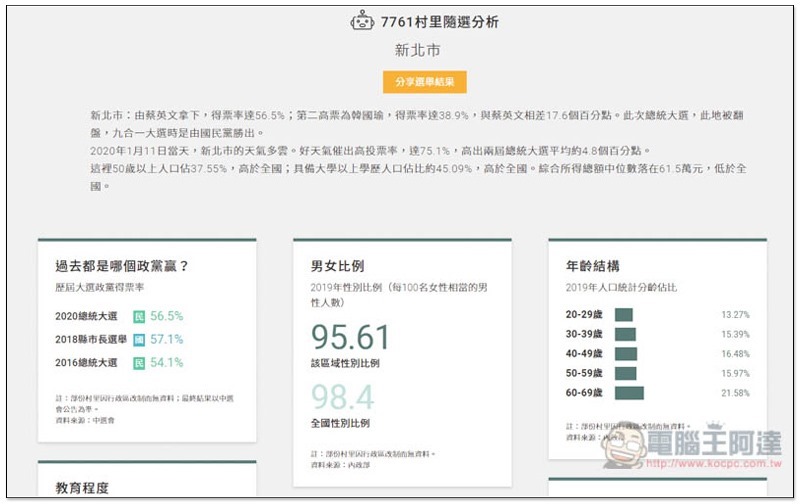
In addition, there is a “robot analysis” function below each information. After clicking it, more detailed analysis data will be displayed, such as male to female ratio, age structure, etc. Those who are interested can also browse:
Supplementary information
Instant ticketing map:Click here to go
Source: KOCPC Chinese