


Stats is a set of free and open source Mac system resource monitoring software. It has quite rich functions. Basically, it can be compared with many paid versions. You can check the real-time CPU, GPU, memory, temperature, battery, and even network usage. It is recommended to everyone.
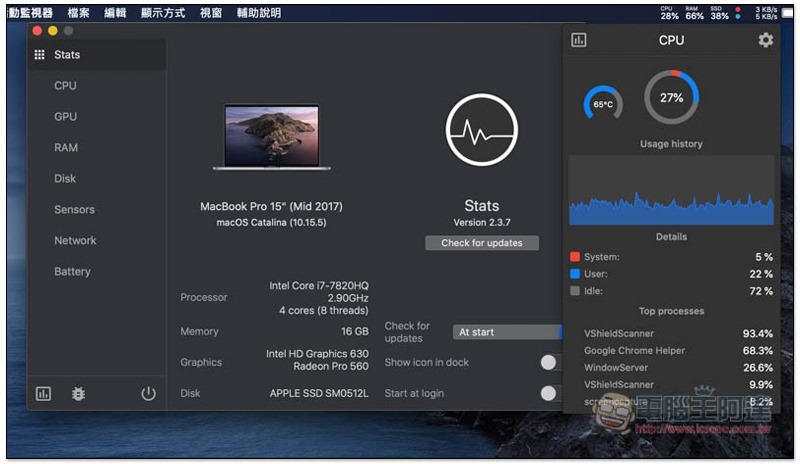
Stats system resource monitoring Mac software introduction
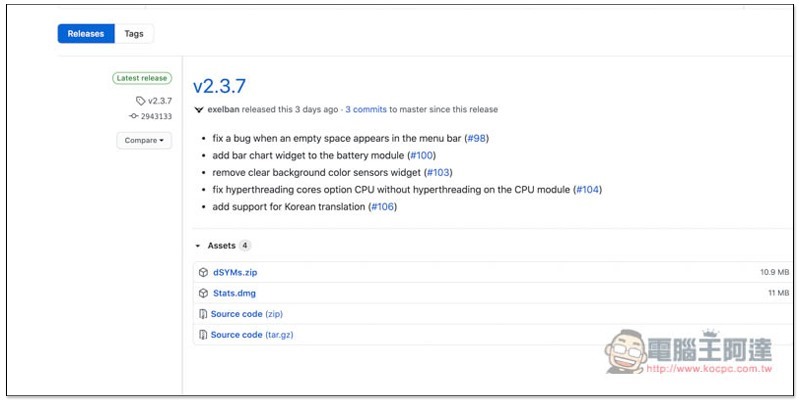
The source code of Stats is on GitHub, and those who are interested can take a look at it themselves.Click me to go to the installation file download page, click to download the .dmg file:
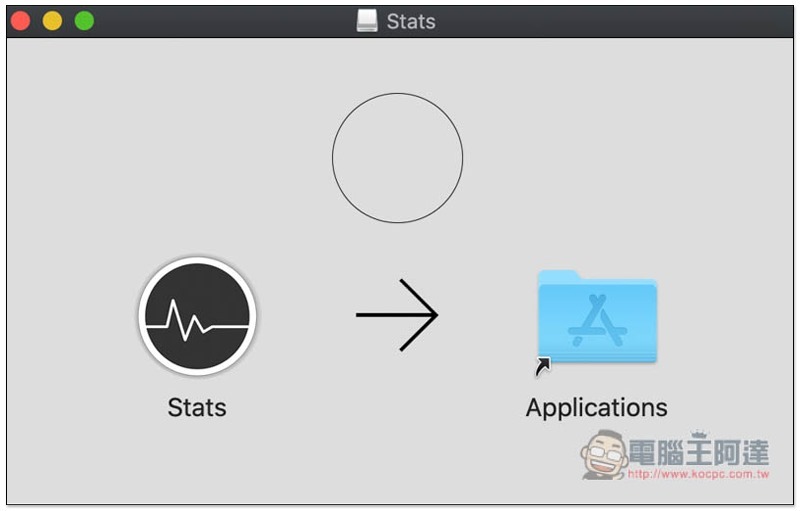
After downloading, open it and drag the Stats icon to the Applications folder on the right, so the installation is complete:
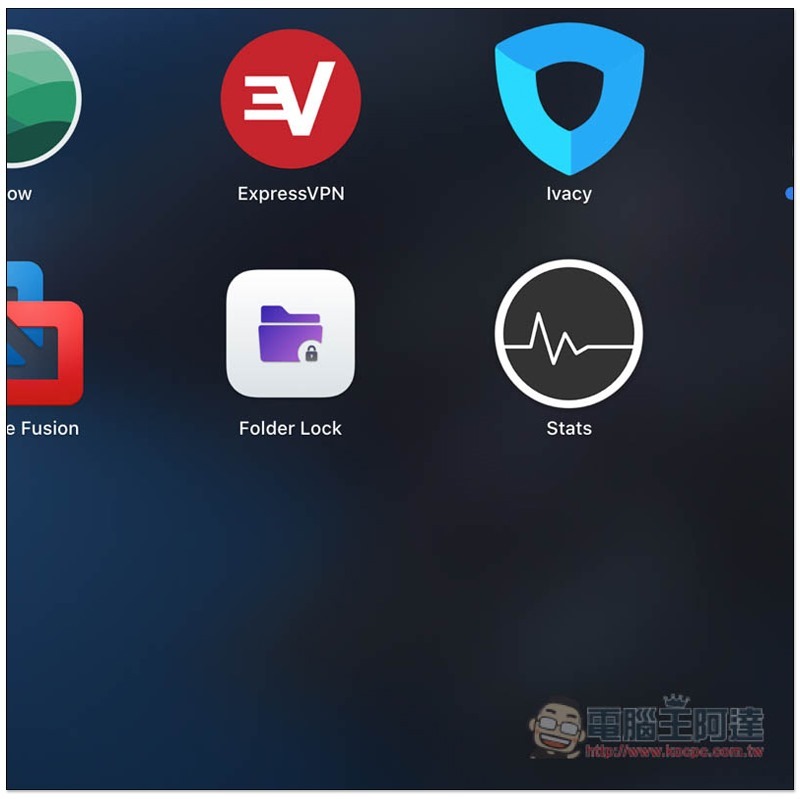
Then you can see this software in Launchpad:
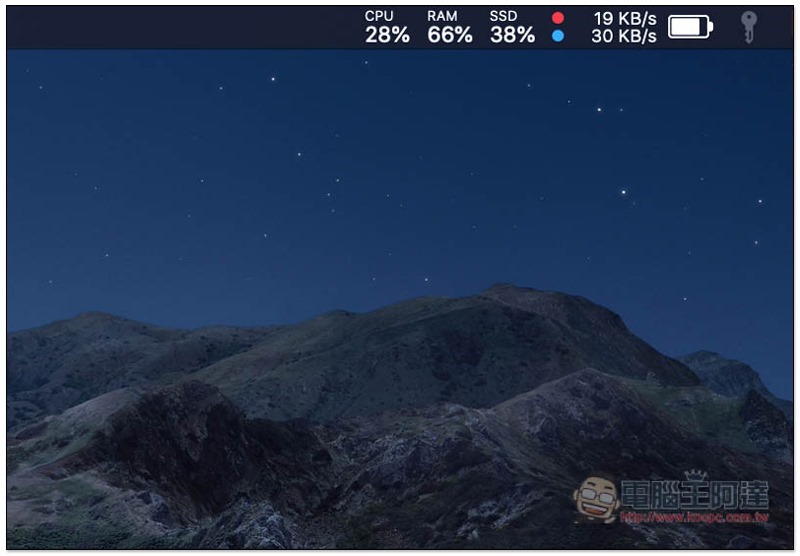
After opening, the usage status of each system resource will appear in the Menu bar in the upper right corner:
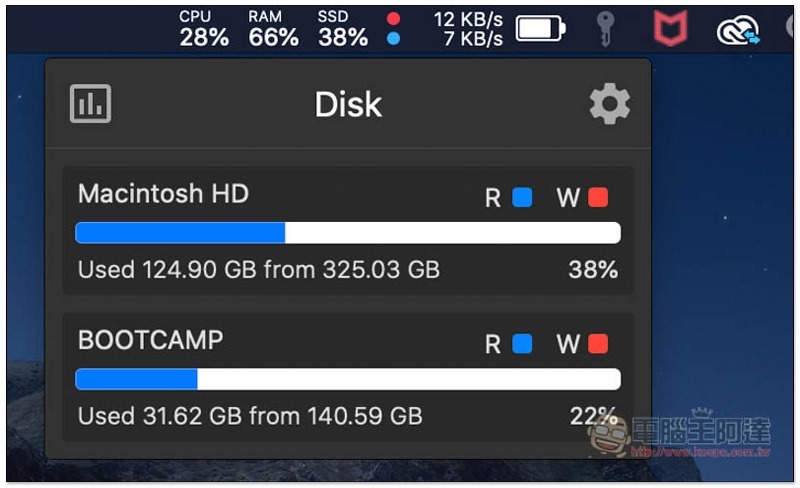
Click to view more detailed information. For the hard drive in the picture below, generally speaking, there should be only one on a Mac. I split one part to install BOOTCAMP, and only two were displayed:
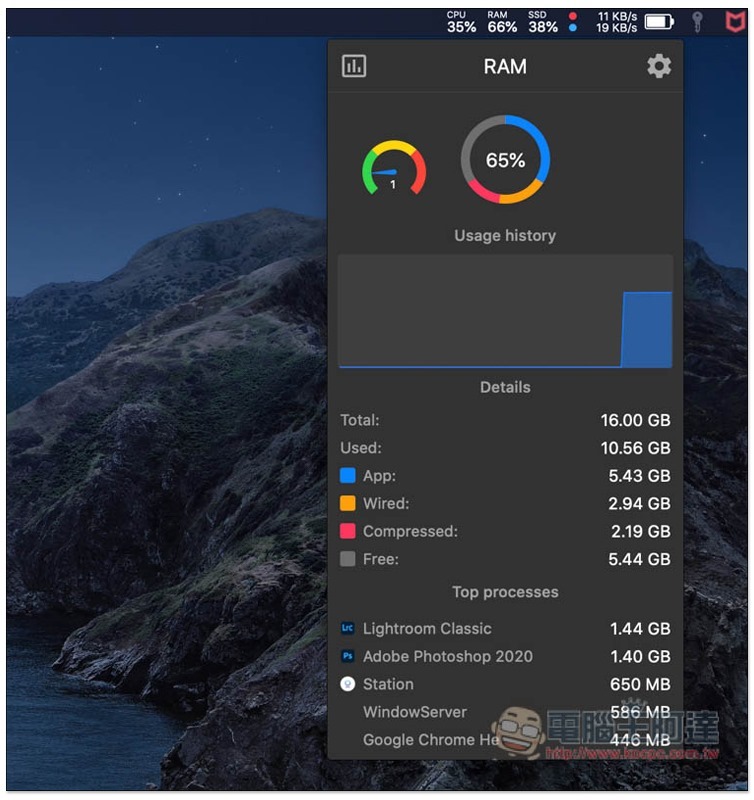
RAM memory, how much memory is used by each set of software will be indicated, so when you feel that your Mac seems a bit slow, use this set to check which software takes up the most memory. It’s a pity that the release function is not provided. It would be better if it was available:
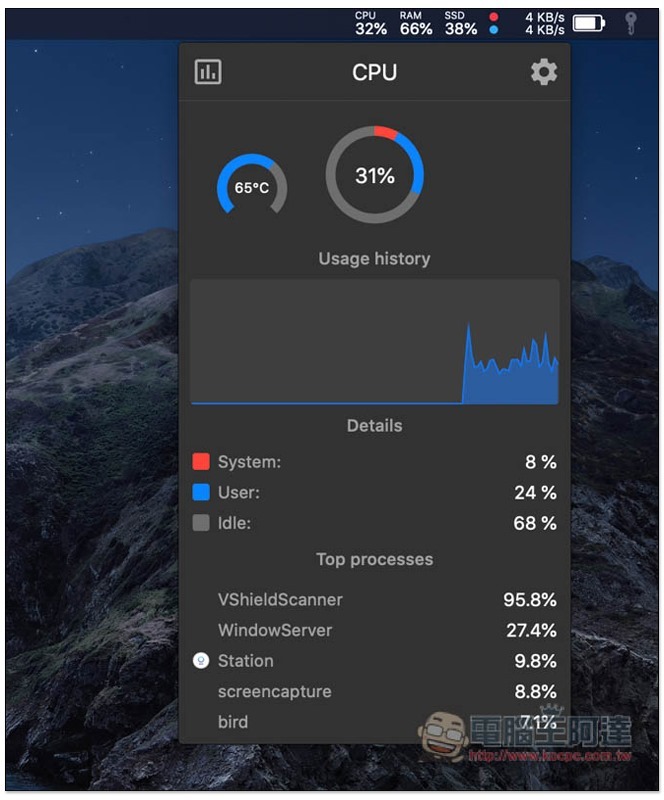
The CPU processor, in addition to the usage rate of each software, will also display the real-time temperature. Details are also divided into system, user, and idle processor usage percentage:
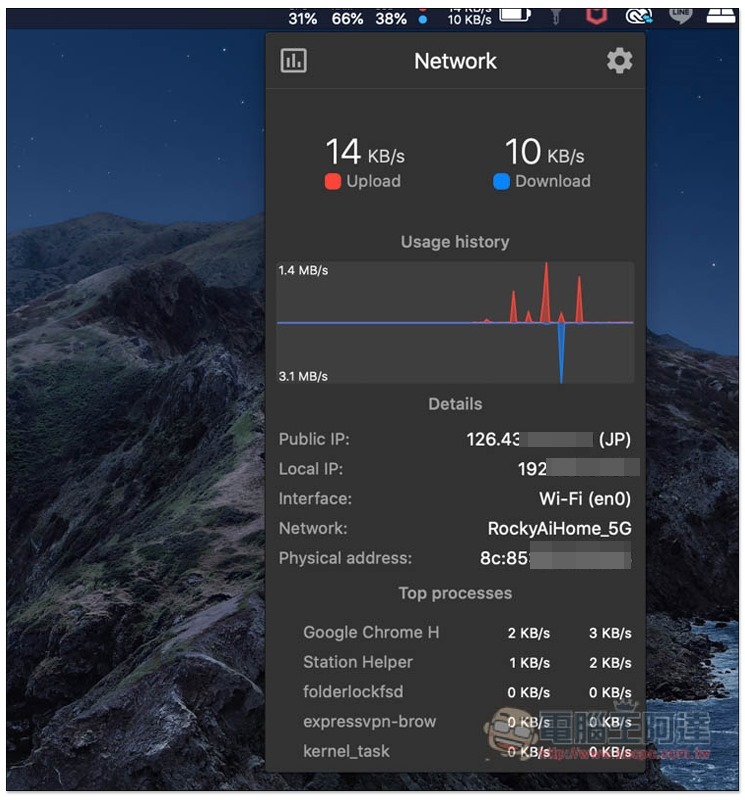
Network resources will tell you real-time upload and download data, as well as your network information, such as: IP location, interface used, etc.:
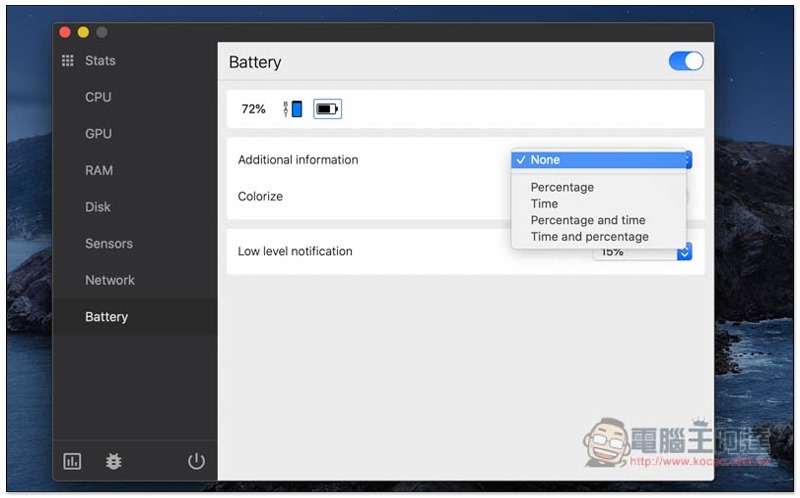
In addition to the above, this set actually has other monitoring information that is not turned on by default. After clicking the setting option in the upper right corner, you will see other resource options, such as: GPU, Sensors, etc. The battery section can also adjust the display percentage, time, percentage and time:
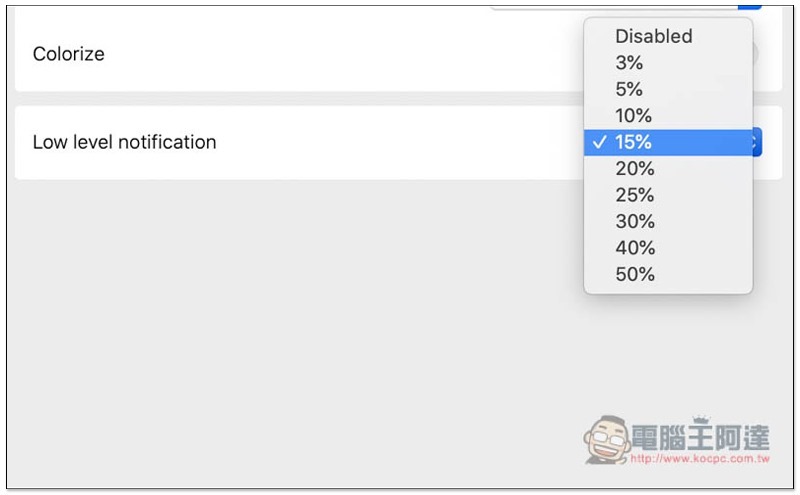
Also supports low battery reminder, default is 15%:
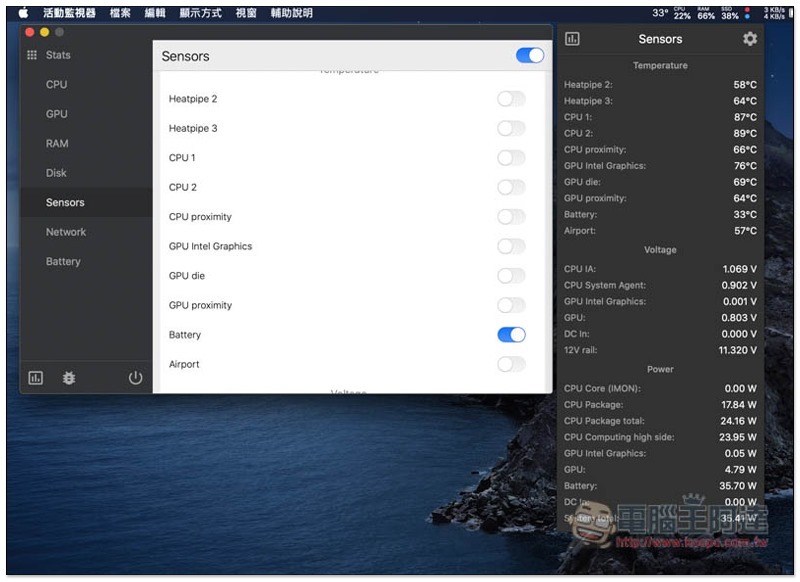
The Sensor part is turned off by default. After turning it on, the real-time temperature information of each hardware will appear in the Menu Bar:
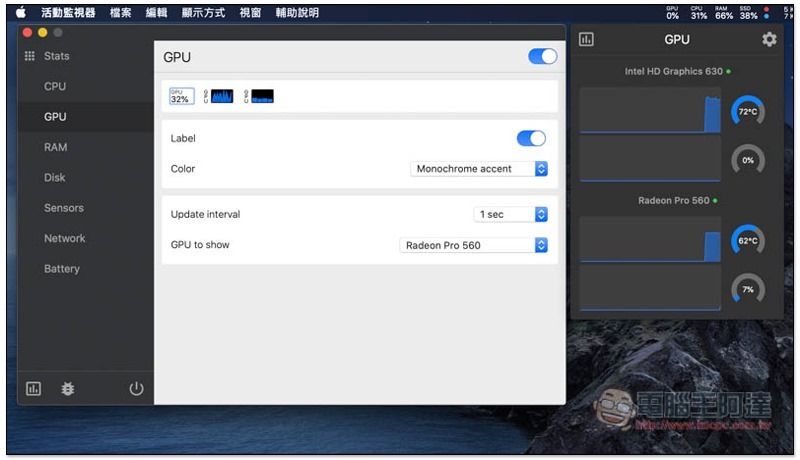
The same goes for the GPU. After opening it, you can view the real-time graphics card usage and temperature. The dual graphics cards will be displayed separately:
Supplementary information
- Tool name: Stats
- Download page:Click here to go
Source: KOCPC Chinese