


We all know that the lightness and darkness of a photo directly affects its success. I have shared before that aperture, shutter speed, and sensitivity ISO are the three elements of exposure, which will directly affect the brightness and darkness of the photo. So how should you ensure that the photo is properly exposed? Or how should we look at underexposure? This article will teach you how to read the photography histogram. If you are interested, read on!
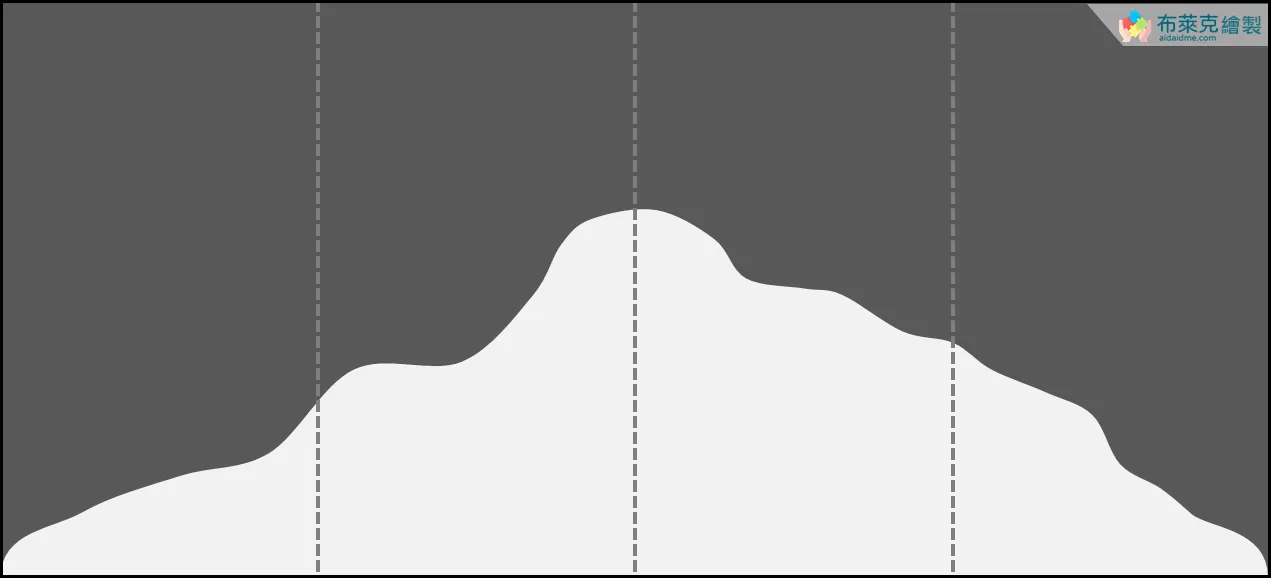
▲ Figure 1: Photographic histogram
If you think the content of the article is helpful to you, thenSubscribe to my contentBar! It’s free! When I publish a new article, it will be pushed to your inbox immediately. This is the easiest and most convenient way to encourage me!
What is a histogram?
Histogram in English is Histogram, which is a statistical tool used to represent the type and distribution of data. The histogram in the camera is used toDisplays the distribution of light and dark levels of pixels in a photo, which is the reference information used to determine whether the photo is exposed., usually displayed at the bottom of the camera screen.
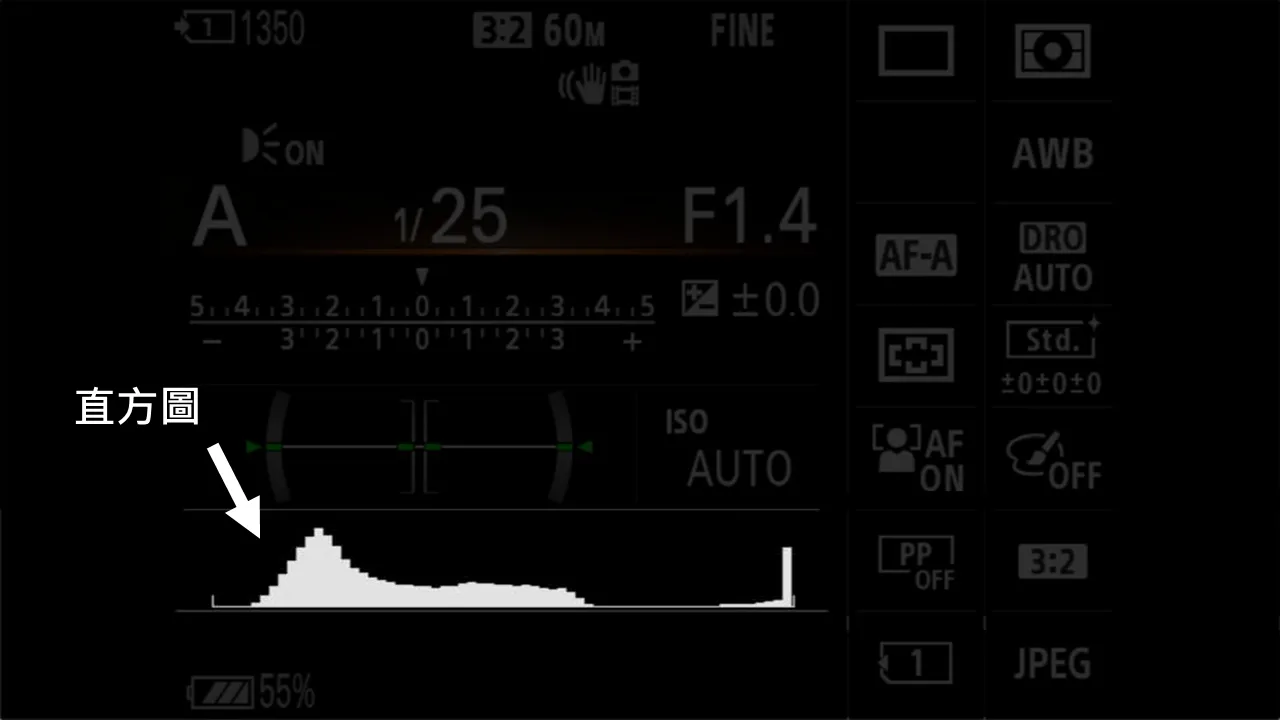
▲ Figure 2: Camera histogram/from Have Camera Will Travel
No matter which camera you use, Canon, Nikon, or Sony, their camera will provide a photography histogram. You should have seen this picture, but you may not know how to interpret it. To put it simply, the closer to the right means adequate exposure, and the closer to the left means underexposed.
The camera histogram will change according to the picture you take. Even the same scene may have different changes due to the intensity of the sun’s rays, whether the weather is cloudy or sunny, the degree of air transparency, and even the use of light reduction filters. The usage of histogram is that simple.
Each camera captures different levels of light and dark
Here I want to give you a basic understanding. In daily life, from the sun rising in the morning to the evening, the brightest light and the darkest light change dramatically. Our human eyes can adapt to the environment and can accurately distinguish the difference between light and dark.
However, cameras are not as powerful as the human eye. The degree of light and darkness that each camera can capture is different. If the range exceeds it, it will be completely black or completely white, which means that details will be lost.
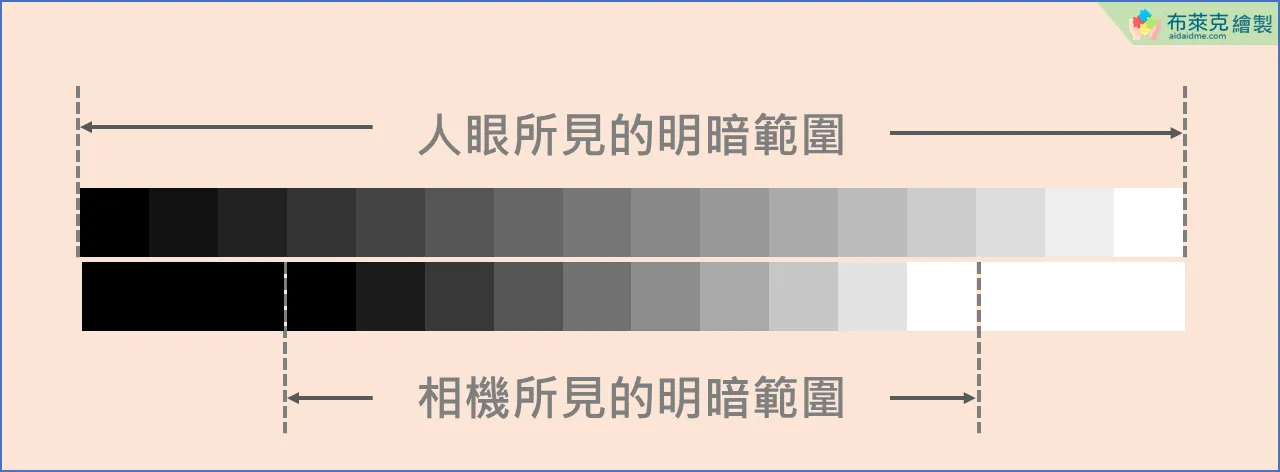
▲ Figure 3: Human eyes vs. the range of light and dark seen by the camera
The picture below is a good example. When we went to a lantern festival at night, even if the lanterns at night were very different in brightness, our human eyes could still easily distinguish them. However, the camera is not good at handling scenery with huge differences in light and dark. If you want to take a clear picture of the night scene and the pattern of lanterns, you often cannot get it clearly.
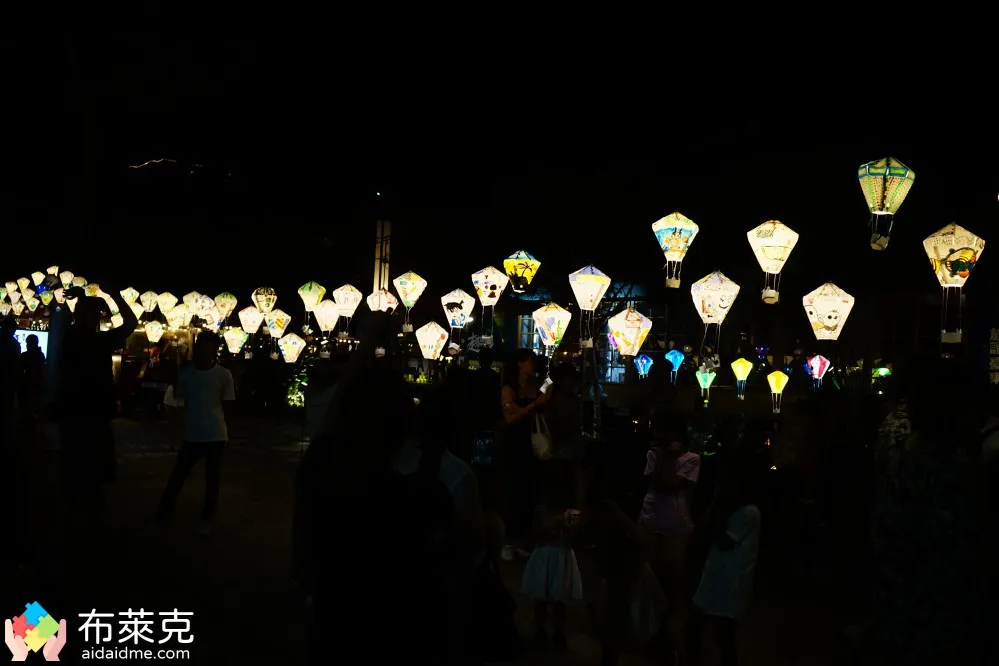
▲ Picture 4: Lantern Festival at night
If you want to get more picture details, you should shoot using the RAW files shared before. One of the features of RAW files is that they can provide more picture details. If you want to know more, you can read the article below.
How much detail can be retained in RAW files? Let me tell you the answer using a histogram.
The photo below was taken in the library of Taitung University. The sun was shining brightly at that time, and the light-receiving surface was actually on the other side. If you use the normal JPEG format to take pictures at this time, you can see that the histogram is almost closer to the left and right sides.
Here you have to remember the conclusion first.The two sides of the histogram represent that the photo is partially overexposed and underexposed at the same time.. No matter which one it is, the details of the photo have been sacrificed, and they must rely on post-production adjustments to have a chance to save them.
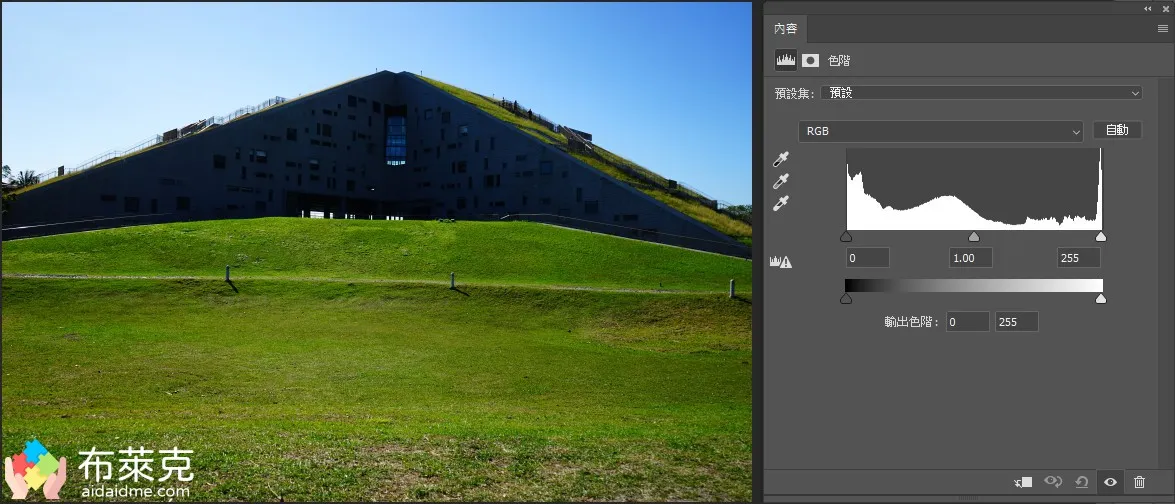
▲ Figure 5: Shooting without RAW file
In order to prevent more details from disappearing, you should choose RAW files to shoot. You can see that the distribution of the histogram has been greatly improved this time and is no longer aligned on both sides. That is to say, the exposure is sufficient, and of course the details are preserved!
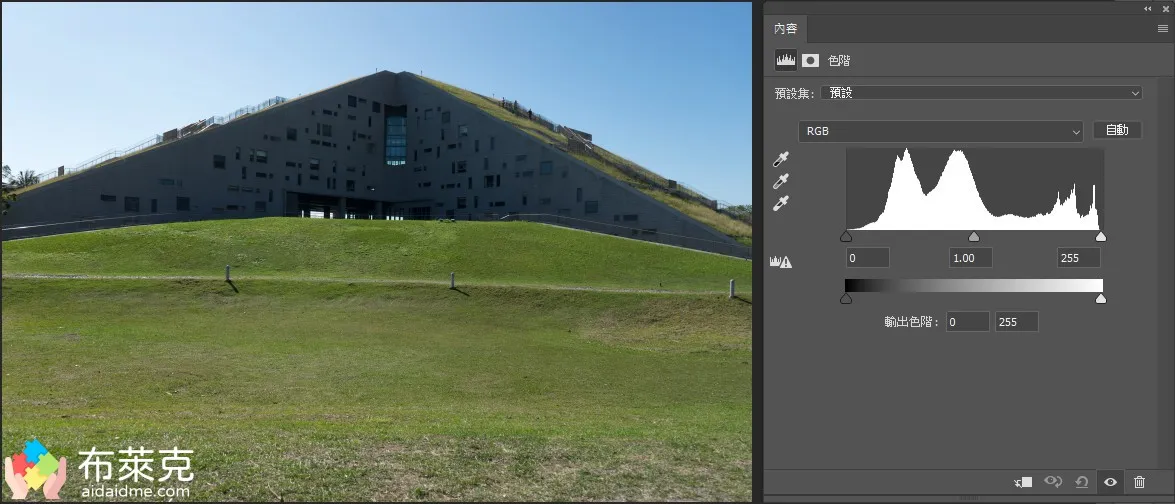
▲ Figure 6: Shot using RAW file
Of course, when shooting in RAW files, there will always be a huge file capacity. If you want to get more details, you sacrifice capacity. However, thanks to the development of science and technology, the rise of .heic The format may overturn past perceptions. For more information, you can read the article below.
How to interpret camera histogram?
There is a basic understanding before. You have learned that the distribution of the histogram represents the degree of exposure. Then the question arises, how to interpret the histogram? What does it mean to stay to the left or to the right?
The X-axis coordinate of the histogram is the distribution of light and dark levels.Black on the far left indicates underexposure, and white on the far right indicates overexposure.。
And the Y-axis coordinate of the histogram is the number of pixels,The higher the value, the more pixels with the same brightness.. Since the greater the number, it means the larger the area, so the higher can be directly understood as the “relatively larger” area, rather than overexposure!
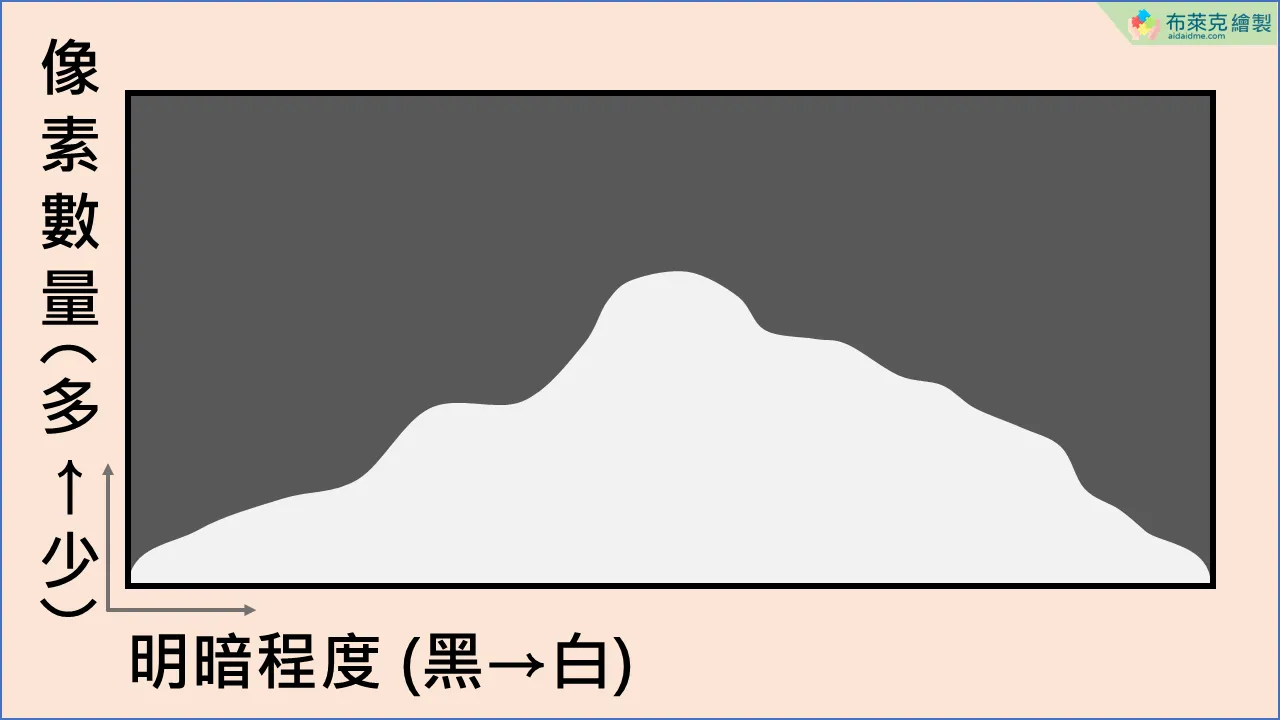
▲ Figure 7: The meaning of the X and Y axis coordinates of the histogram
Sometimes some more professional software will cut the histogram into 4 equal parts, divided into dark gray, medium gray and darker, medium gray and light gray, and light gray. The content of the description is the same.
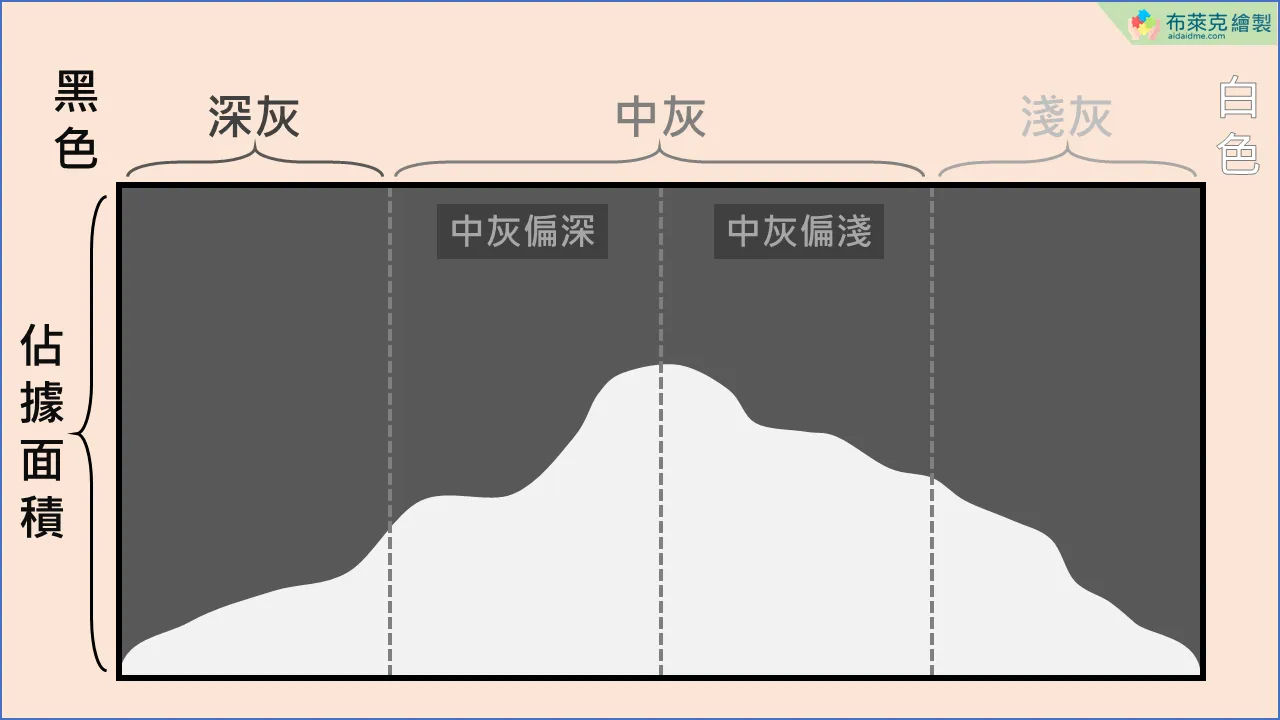
▲ Figure 8: The histogram can be subdivided into 4 equal parts
If you want to learn more photography composition techniques, many methods have been compiled before. You are welcome to check out the article link below, and you can also share it with your circle of friends!
- Have you ever forgotten photography composition once you learned it? Teach you 6 ways to practice composition thoroughly, so that novices can get rid of the trouble of forgetting!
- Super practical composition method, novices can master these 7 principles to let photos tell a good story
- How to take a group photo? 6 simple steps to use creativity to create great new ideas
- How to take photos of lightning on rainy days? 6 steps to teach you how to take breathtaking photos of natural beauty
- How to take photos of flowers? Teach you 6 simple and practical techniques, so that even beginners can take good photos
Why can’t you judge exposure with your eyes?
At this time you may say, “Why do I need to look at the histogram? I look at it with my eyes!”
▲ Figure 9: It’s not a good idea to check the exposure with your eyes/from Pexels
actually,Whether you have to use your eyes or the LCD screen on your camera to judge exposure, these are unreliable methods.. How to say it?
Take a look at the two photos below.
Whether you look at this photo on a computer screen or a mobile phone screen, you should feel that the shadow area in the mountainous area has been underexposed, and the sunset sun has been overexposed!
But is that really the answer?
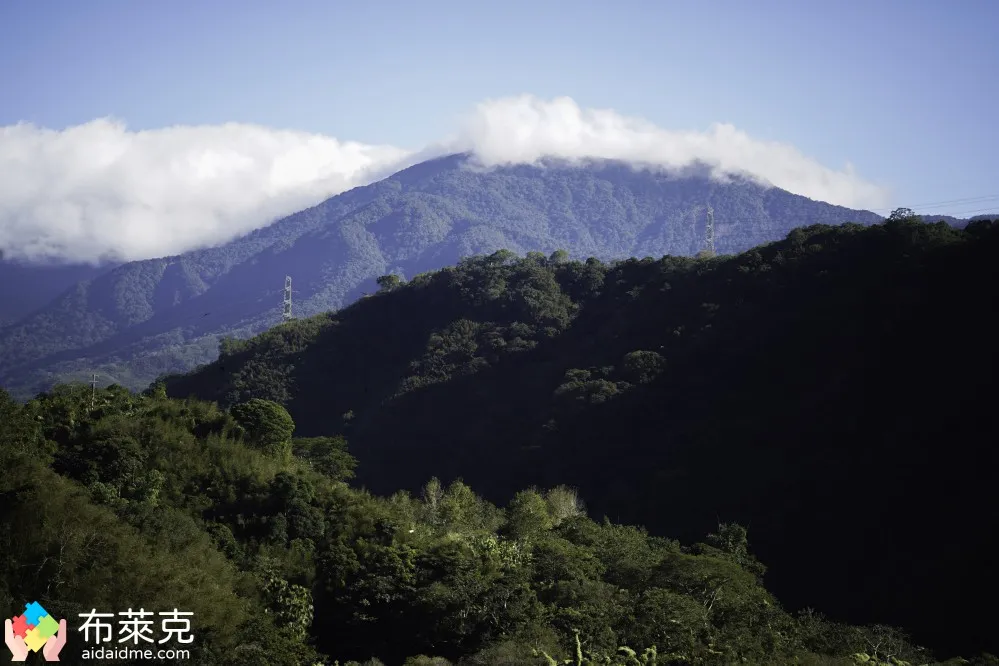
▲ Figure 10: Mountain scenery photo
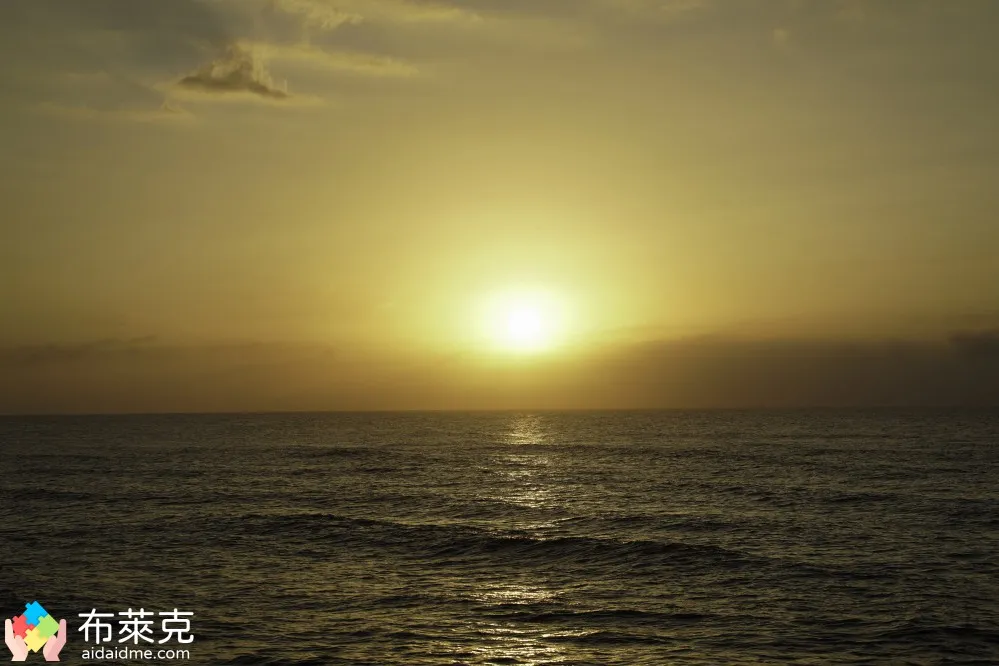
▲ Figure 11: Sunset landscape photo
The answer is revealed,Neither photo is overexposed or underexposed.. Below are the histograms of these two photos. If you still feel that these two photos are too dark or too bright, it means that you should increase the brightness of the screen or mobile phone, or change it, so that the color rendering will be more normal.
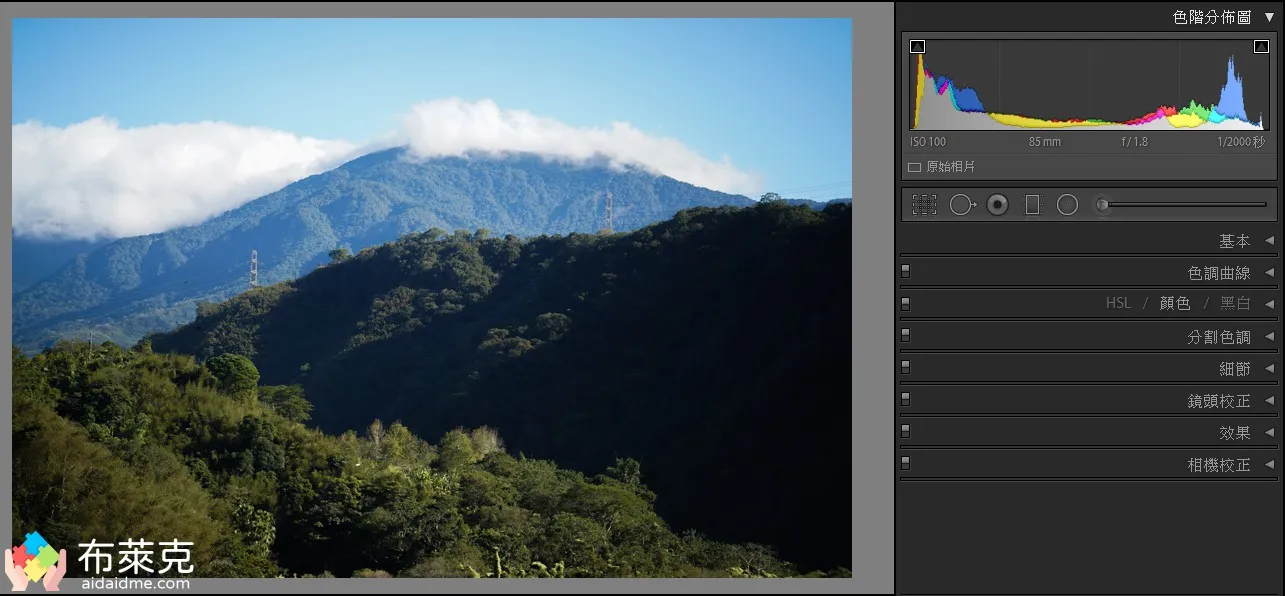
▲ Figure 12: Histogram of mountain scenery photos
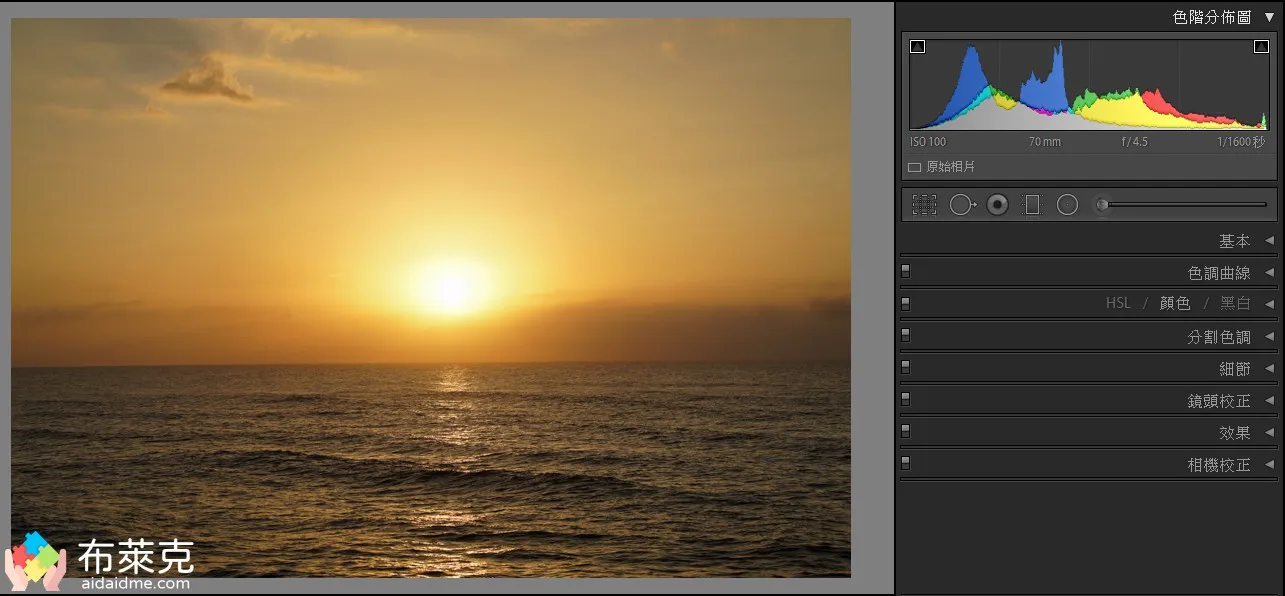
▲ Figure 13: Histogram of sunset landscape photo
But judging from the statistics of the histogram, it is almost reaching the left (underexposed) or almost reaching the right (overexposed).
Therefore, the eyes or the camera’s LCD screen are very affected by ambient light. For example, when checking the exposure under the bright sun, it is easy to think that the photo is underexposed. On the contrary, if you view the photo in a dark car, you will feel that the photo is overexposed. In fact, the exposure may be just right.
Therefore, pleaseIs it more appropriate to use a histogram to judge exposure?。
Examples of using photographic histograms
Then the editor found a few photos that were taken in the past to let you see the relationship between the histogram and the actual photos. They can be divided into 5 categories in total:
- Medium gray case (proper exposure)
- Dark gray case (may be underexposed)
- Light gray case (may be overexposed)
- High contrast cases (large differences in light and dark levels)
- Low contrast case (little difference in light and dark)
Medium gray case (proper exposure)
This refers to a photo whose histogram distribution is toward the middle, indicating adequate exposure. Photos of this type of item will not have areas that are too bright or too dark.
The histogram distribution of the picture below is short but wide, with moderate brightness. However, there is still a small area on the side of the chopsticks that is underexposed. With your eyes, you may think that the reflective parts of the carrot cake or soy sauce paste may be overexposed, but in fact they are not.
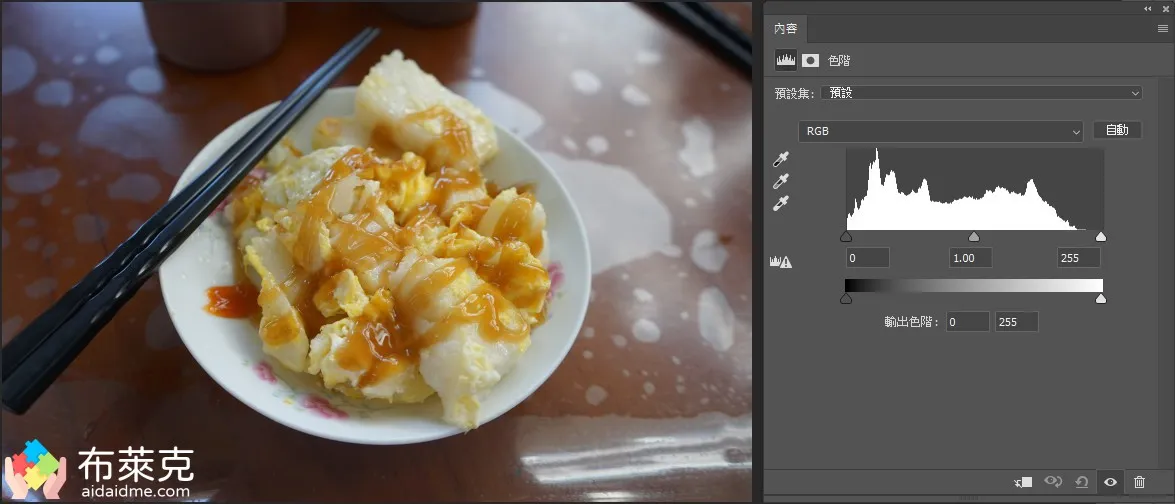
▲ Picture 14: Delicious breakfast
In the histogram of this tree branch, the middle gray occupies most of the area of the screen, and the overexposed position on the far right occurs in the lower right corner of the screen. Overall, this medium-gray photo looks quite satisfactory.
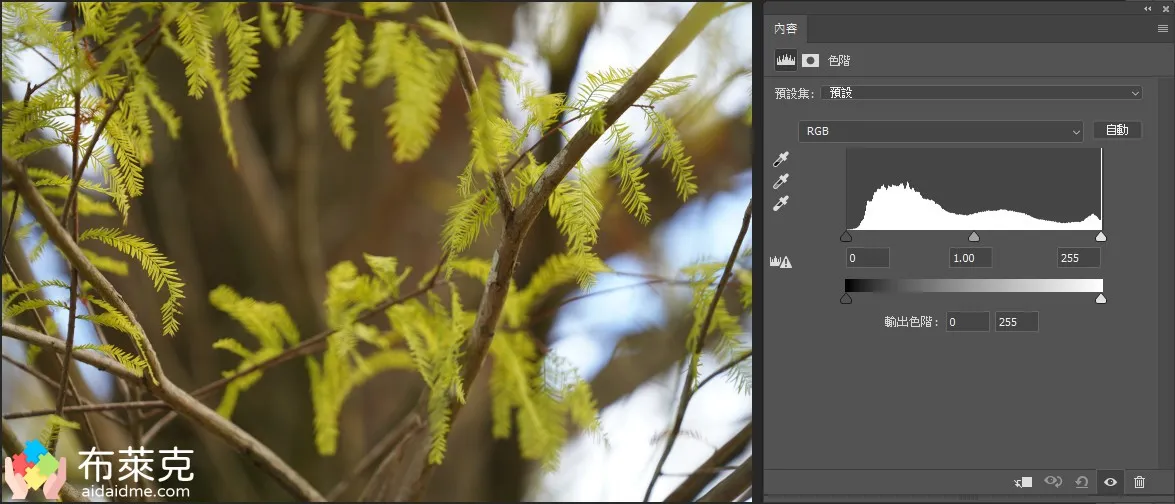
▲ Picture 15: Golden leaves
Dark gray case (may be underexposed)
This refers to photos whose histogram distribution is skewed to the left, indicating underexposure. Subject matter such as sunrise, sunset, night scene, star trails, Milky Way starry sky, etc. are all histograms of this type.
In this photo, the shadow area under the tree does not receive enough sunlight, but if you look carefully at the photo, you can tell the direction of the branches, and the details are still there. That is, although the brightness is not enough, it is not underexposed.
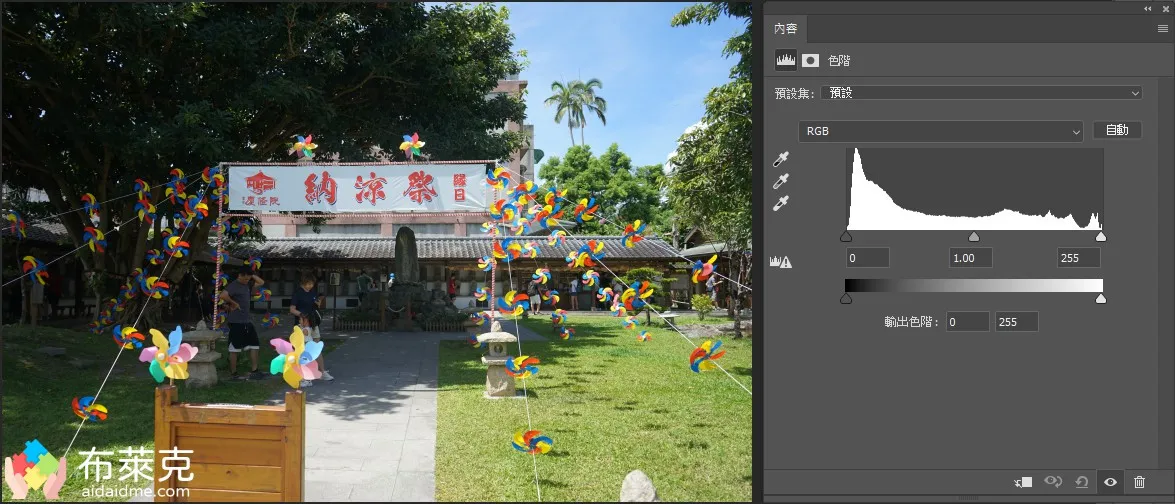
▲ Figure 16: Ji’an Keixuyuan
This shot of the Grand Hotel at night has mostly dark colors, but you can still see the details and gradients clearly, and there are fewer underexposure problems.
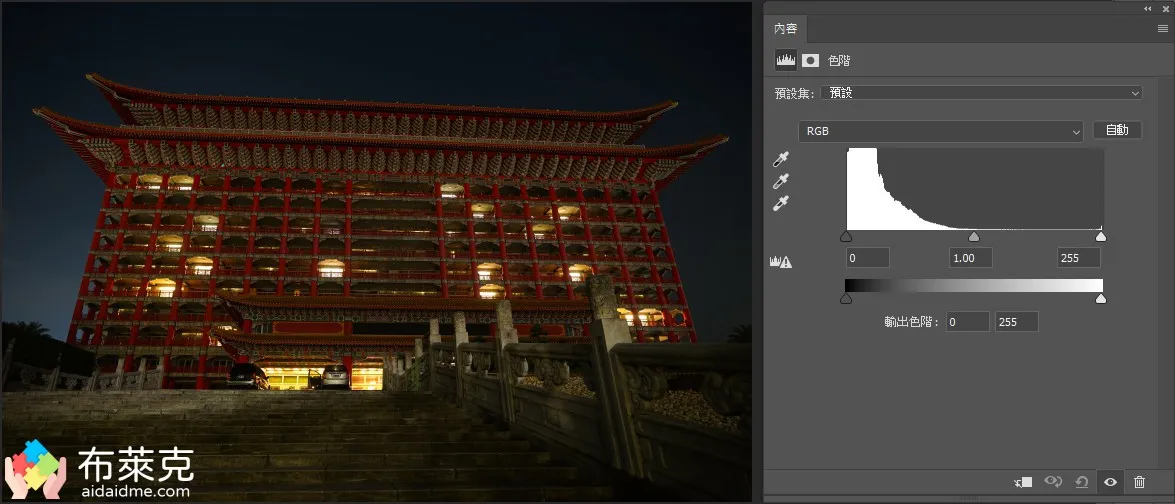
▲ Picture 17: Grand Hotel
Light gray case (may be overexposed)
This refers to photos whose histogram distribution is skewed to the right, indicating overexposure. Subject matter such as noon time, backlit scenes, sky, snow scenes, product photos, etc. are all histograms of this type.
With the previous explanation, you should have a better idea. It is easier to lose gradient details in the sky during the day. At this time, you can use a faster shutter speed or add a light reduction filter to avoid overexposure. The clouds in the sky in this photo are also almost overexposed.
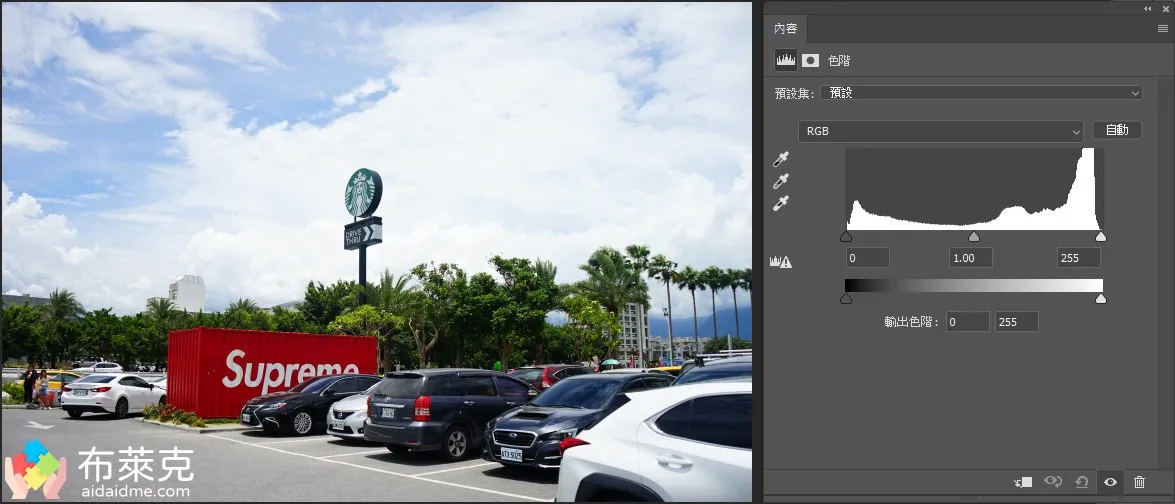
▲ Figure 18: Parking lot
Although the sky in front of the Quanlian Welfare Bear is very bright, there are still details if you look carefully. If the sky were brighter, it would probably be overexposed.
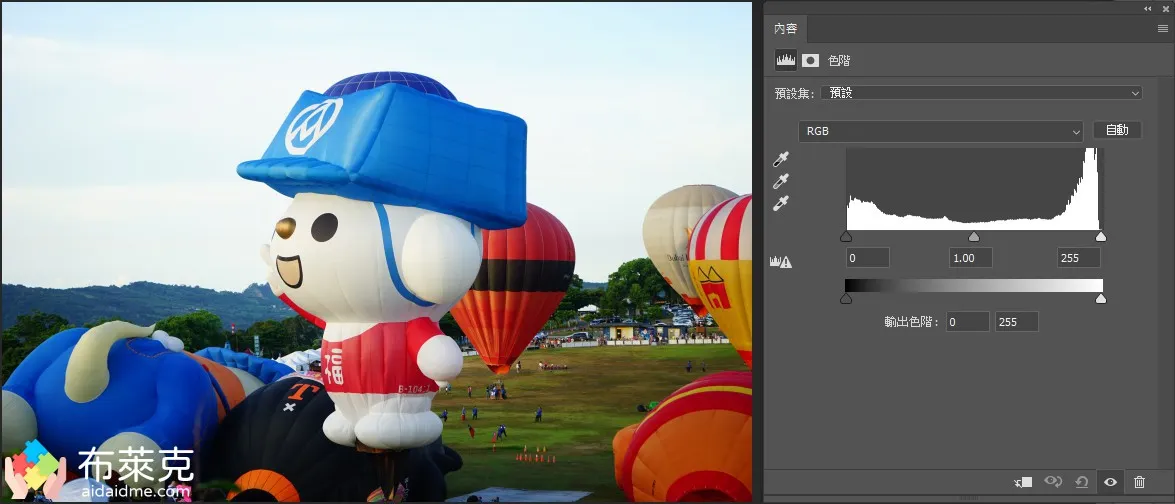
▲ Picture 19: Taiwan International Hot Air Balloon Carnival
High contrast cases (large differences in light and dark levels)
This refers to photos whose histogram distribution is skewed to the left and right at the same time, resulting in overexposure and underexposure at the same time. Silhouette photos are the most classic example.
The point of a silhouette photo is that you cannot see the details clearly and can only keep the outline for the audience to appreciate. If you take a silhouette photo and you can still see the details, it cannot be called a silhouette.
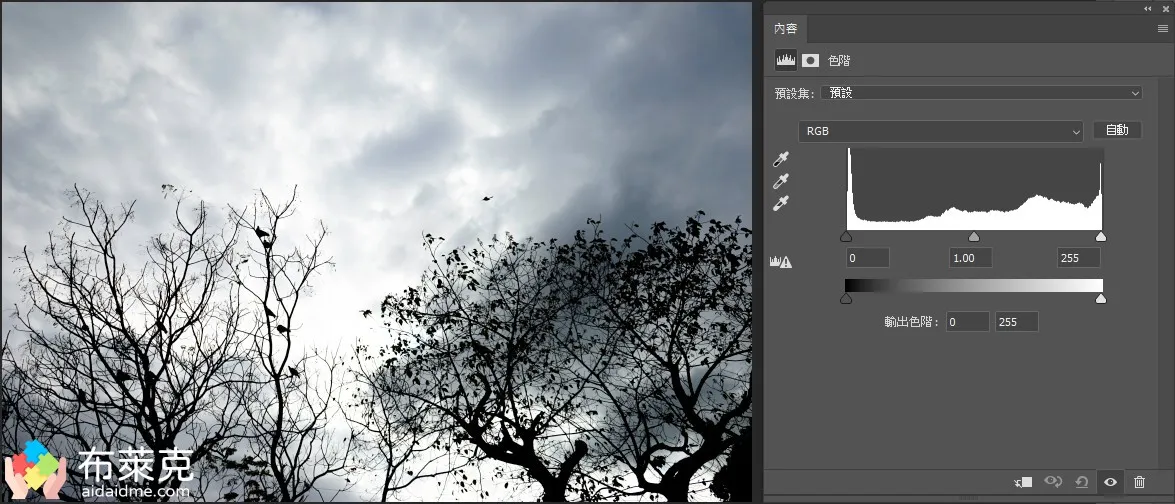
▲ Figure 20: Tree silhouettes
In fact, silhouette is a shooting method with great artistic value. It may seem simple, but it is very difficult to express an idea with a completely black human form or body. The editor has already written an article about silhouettes before. If you are interested, go and learn about it!
Low contrast case (little difference in light and dark)
This means that the histogram distribution will only be biased towards a certain block, and the remaining blocks will not have any pixel distribution. For example, weather after rain, snow scenes, and fireworks fall into this type of histogram.
There is no obvious contrast in this photo, and the light and dark levels are almost the same, which is not a common type in life.
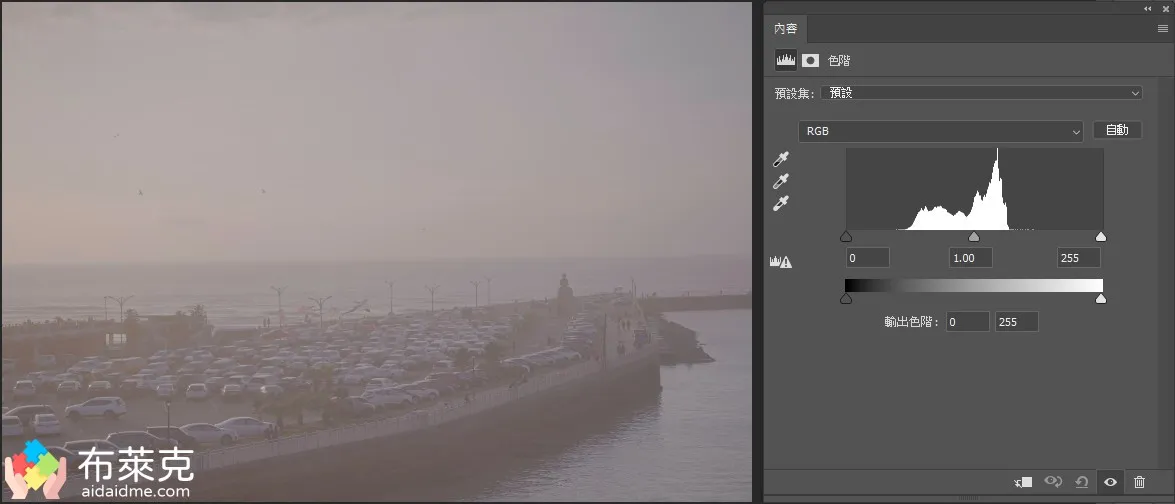
▲ Figure 21: Yongan Fishing Port
Conclusion
The above is the interpretation method of histogram, as well as some practical cases. I have to say that there are indeed a few photos that have undergone some post-production methods to adjust the color for teaching purposes. The most obvious one is probably the one at Yong’an Fishing Port. It was really a big change XD.
After some explanations above, you should find that whether a photo is too dark or too bright does not completely ruin the artistic conception of that photo. Instead, you should look at the type of photos you want to take to determine how to set the exposure level.
This type of teaching articles usually takes a lot of time to reduce difficult vocabulary and find suitable materials. If it really helps you, please move your fingers and help me share it.。
If you like the above article, welcomeSubscribe to newsletter, and you will receive photography-related teaching articles!
by Engineer Blake
Source: KOCPC Chinese