


Nowadays, all AI services are promoting Deep Research features, and the reports they generate are quite rich and complete, so the main difference is how many times are offered “free”. Recently, I discovered that Sider AI’s Deep Research feature is very special, with two unique characteristics. First, the generated reports come with charts, not just text. Second, it can convert the content into a visual webpage. These are things that other AI services don’t have. I highly recommend everyone try it.
Sider AI Deep Research reports not only come with charts and graphics, but can also generate visualized web pages.
Sider AI is a fairly well-known Chrome AI extension. While it’s not completely free, it does offer free credits to try out various features. Deep Research, on the other hand, is currently available on the official website, and everyone gets 3 free tries. After that, points will start being deducted.
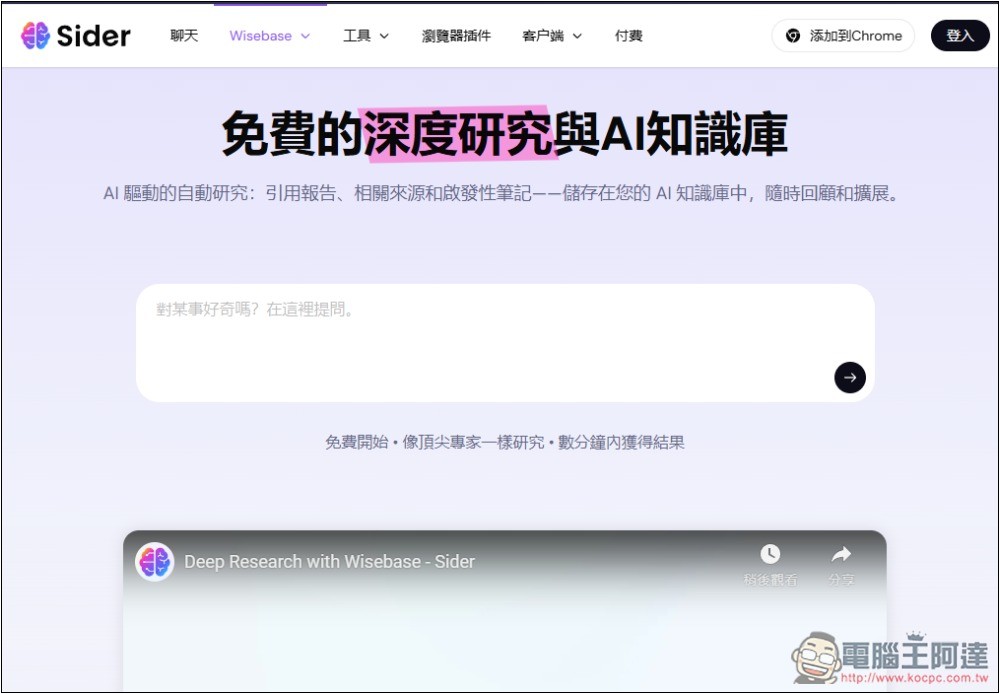
After clicking the link above to enter Sider’s Deep Research page, input what you want to ask about—the more detailed, the better. For example, I asked about the current economic forecast, mentioned that I want to use it for investment advice, and then focused on the Taiwan market:

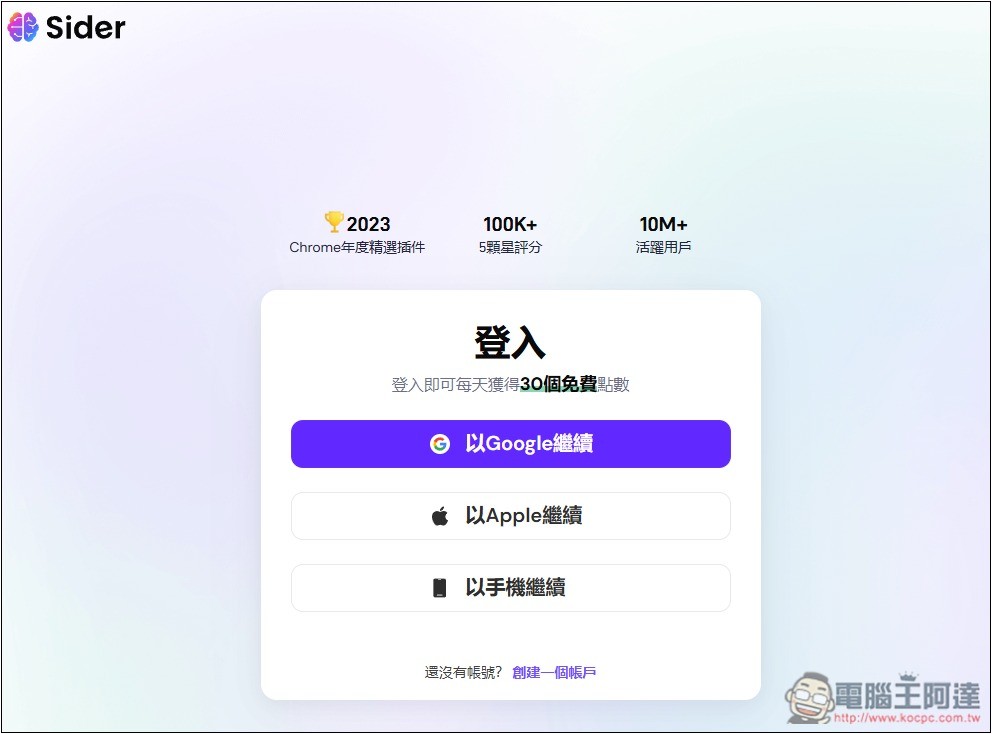
Next, it will ask you to log in. If you don’t have an account, just register for free:
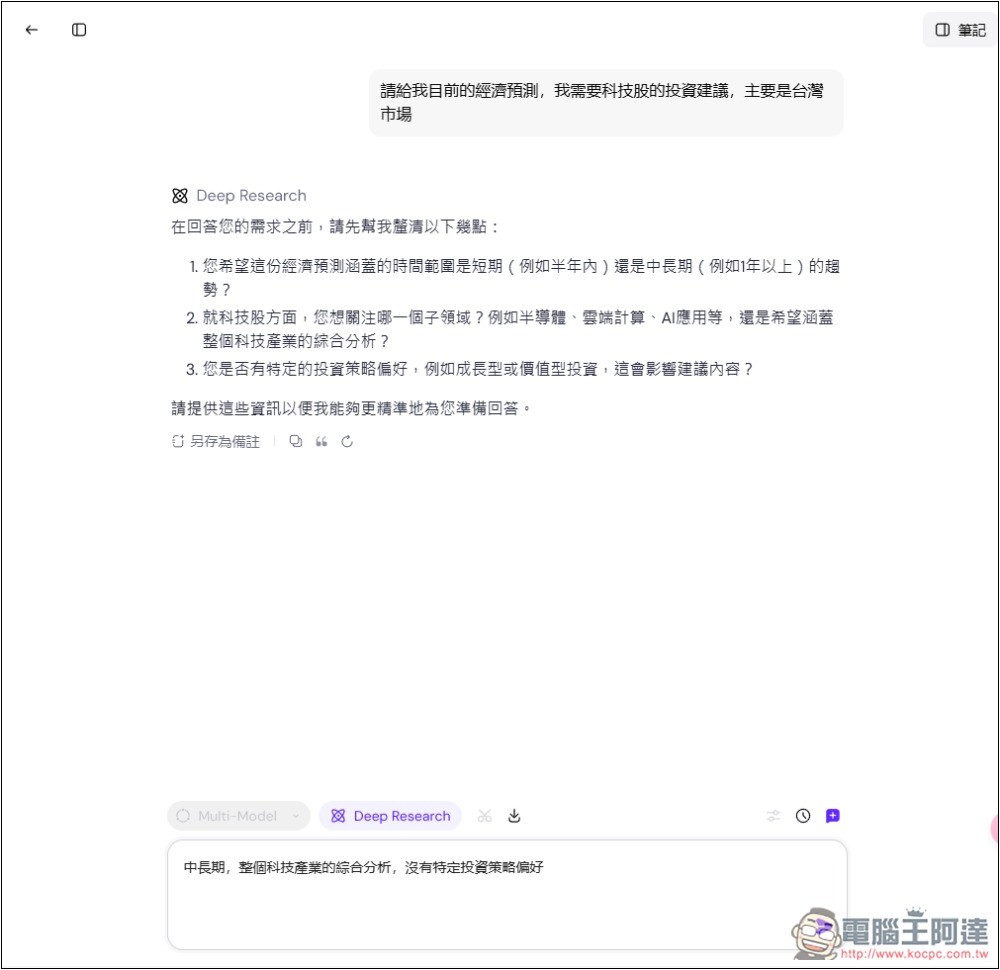
Once you enter the chat interface, just like other AI services, Sider’s Deep Research will first confirm more specific details with you:
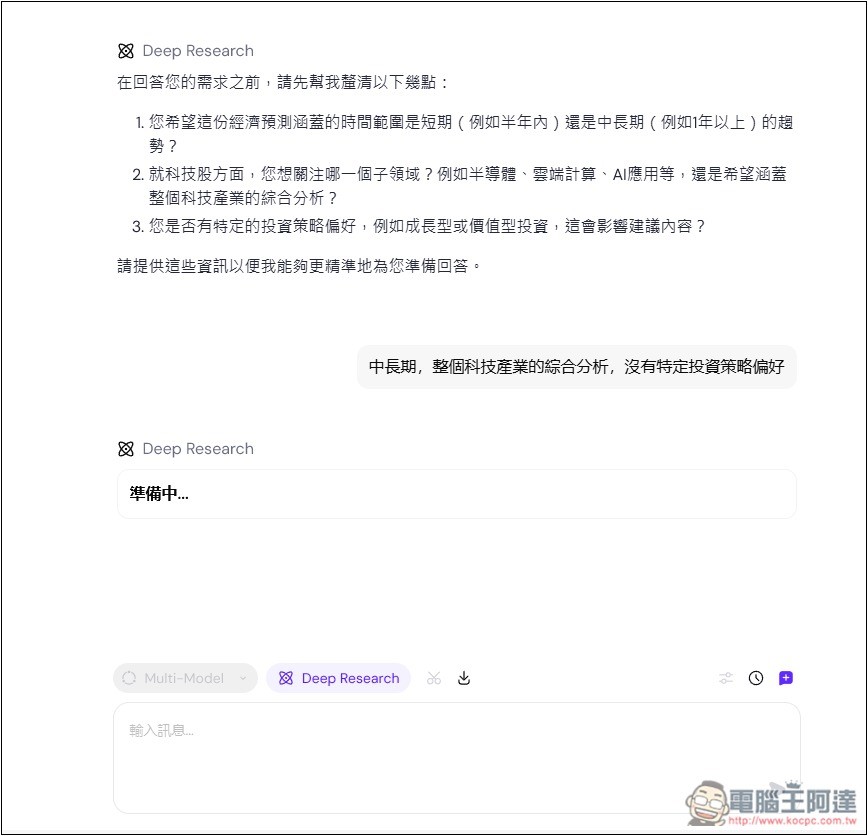
After replying, I’ll begin preparing for in-depth research. Depending on what you’re asking about, it will generally take several minutes to complete.
It will search many relevant websites and then conduct research. For those who can’t wait, you can also close this webpage, and it will continue researching until the report is complete:
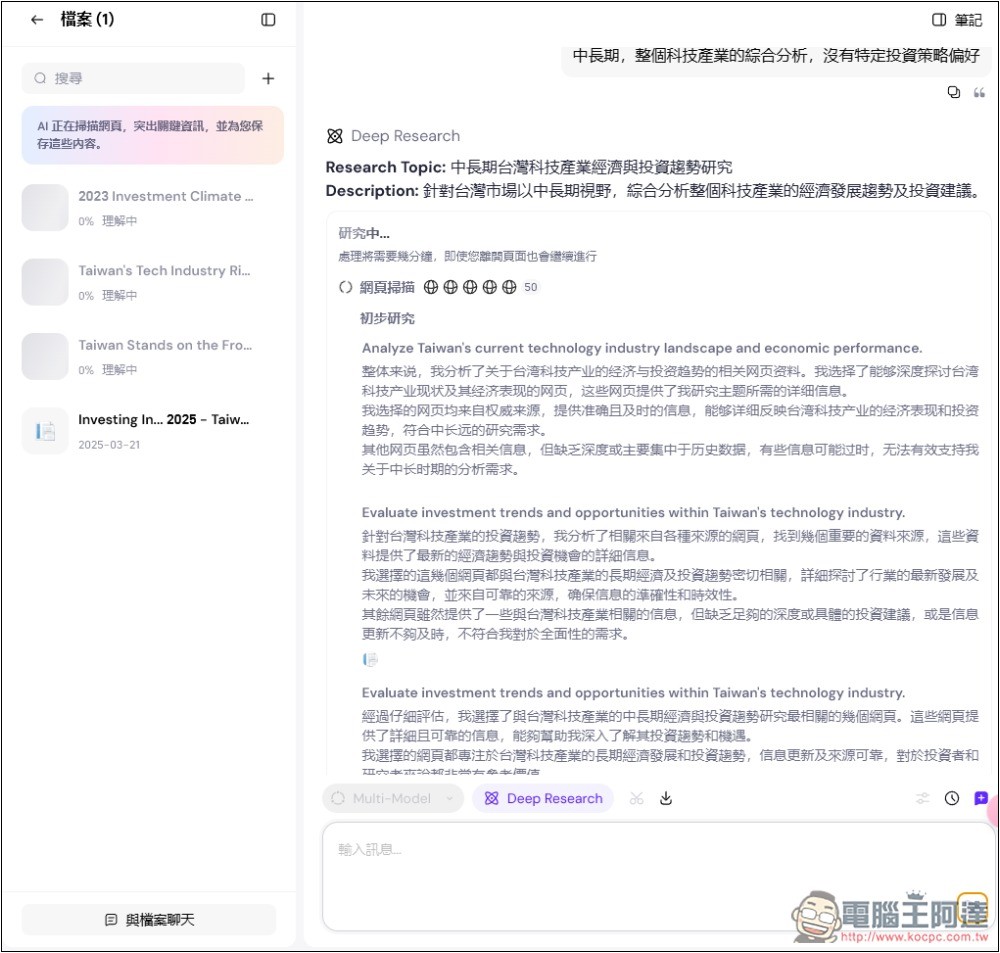
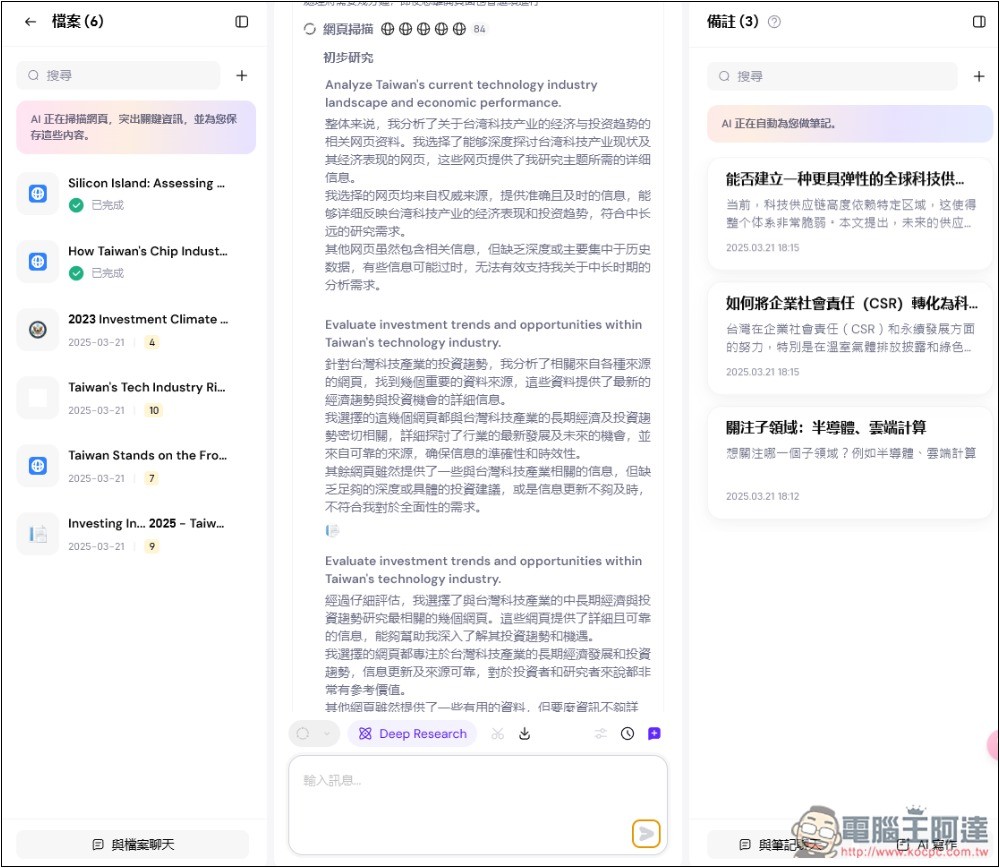
Once the reports are researched, AI notes will start appearing on the right side. After all the reports have been studied, a summary will be generated based on this content.
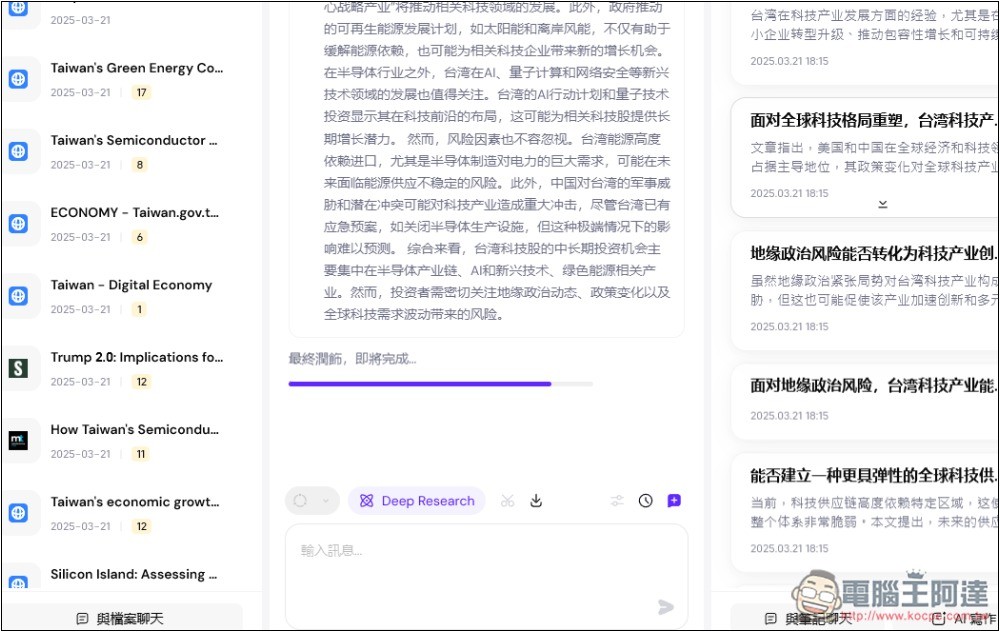
When it’s almost done, the bottom turns into a progress bar:
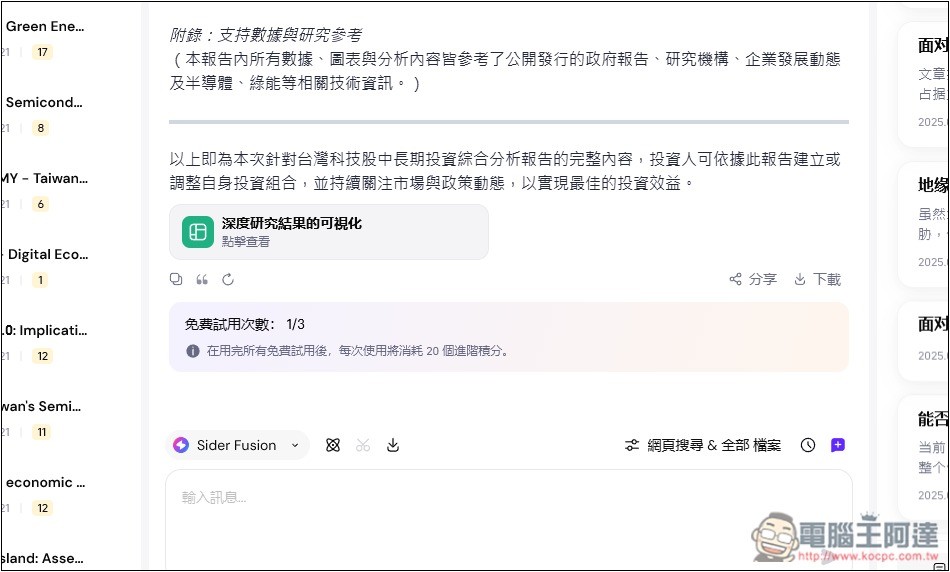
After completion, it will display how many free attempts remain. Free members can try it three times. After that, each use will deduct 20 points, and logging in daily gives 30 points, meaning you can use it at least once a day.
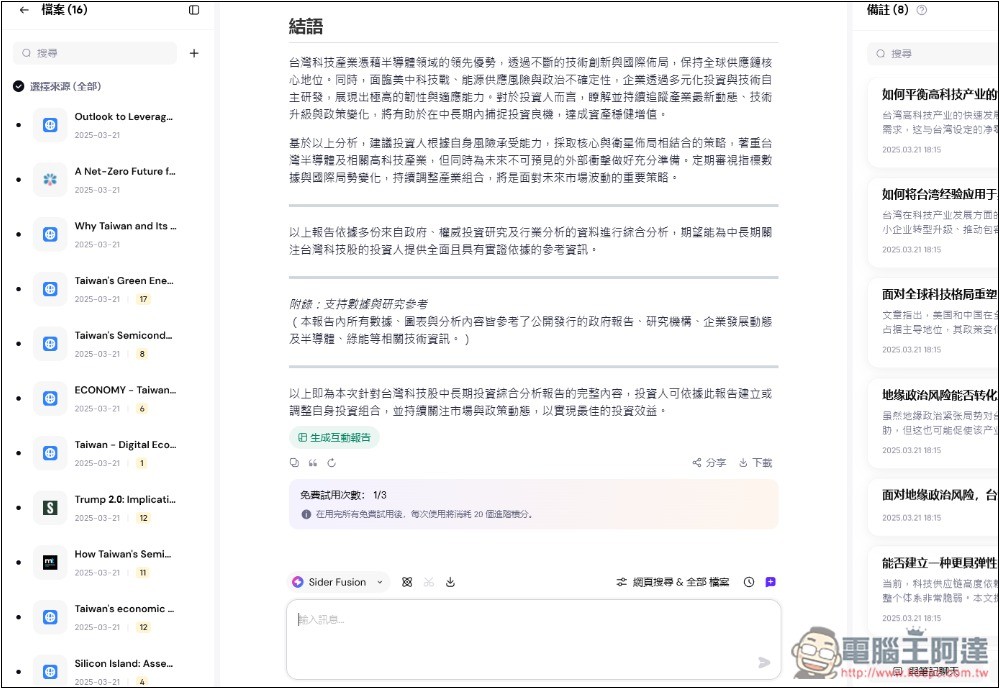
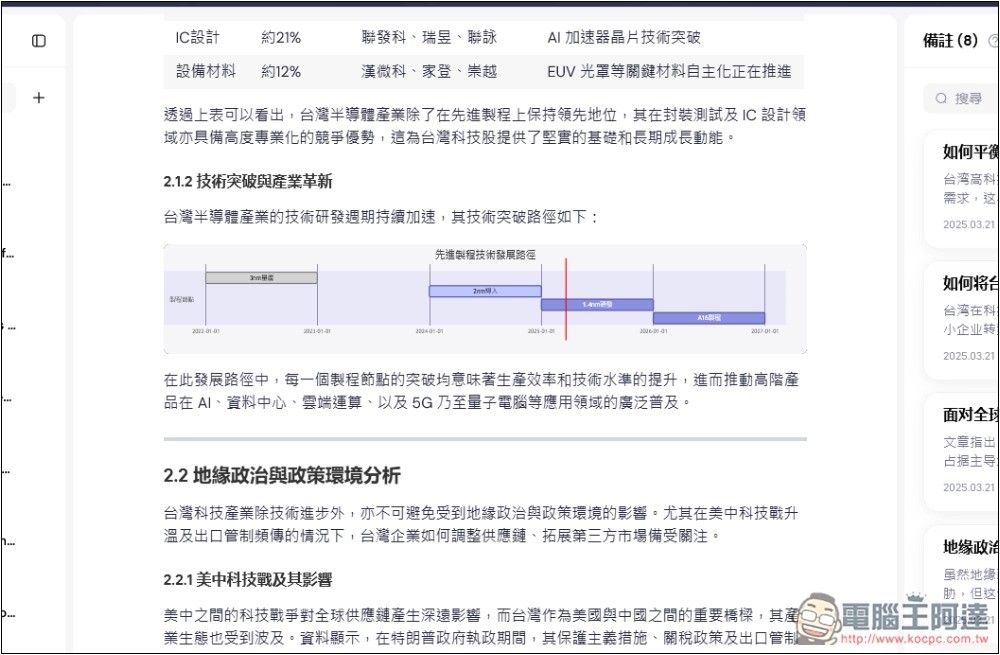
When you browse the report, you’ll see that the content is not just text; it also includes charts and tables to help you understand it:
If you want to share this report with others, click ‘Generate Interactive Report’ at the bottom, which is the visualization webpage mentioned earlier:
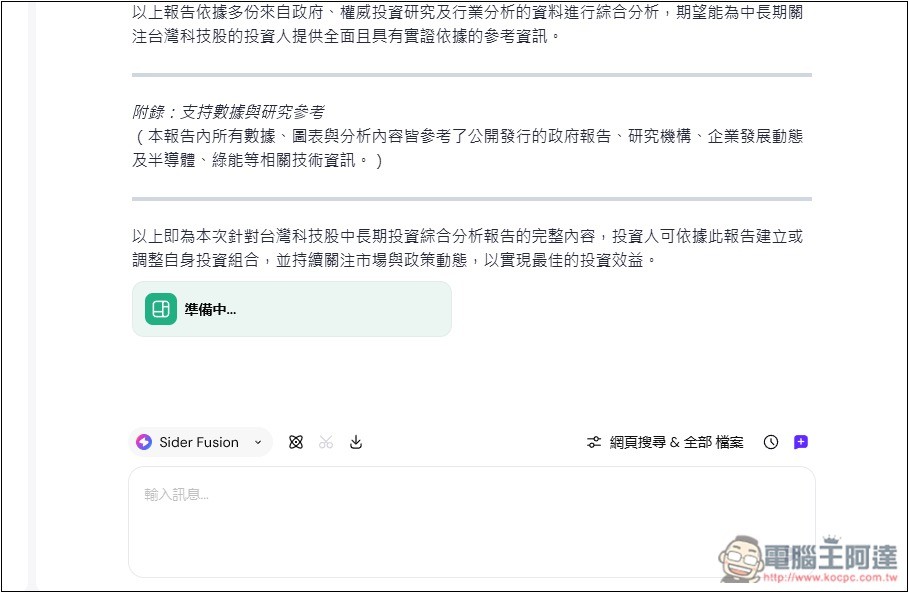
Generation will also take some time, approximately 3~5 minutes:
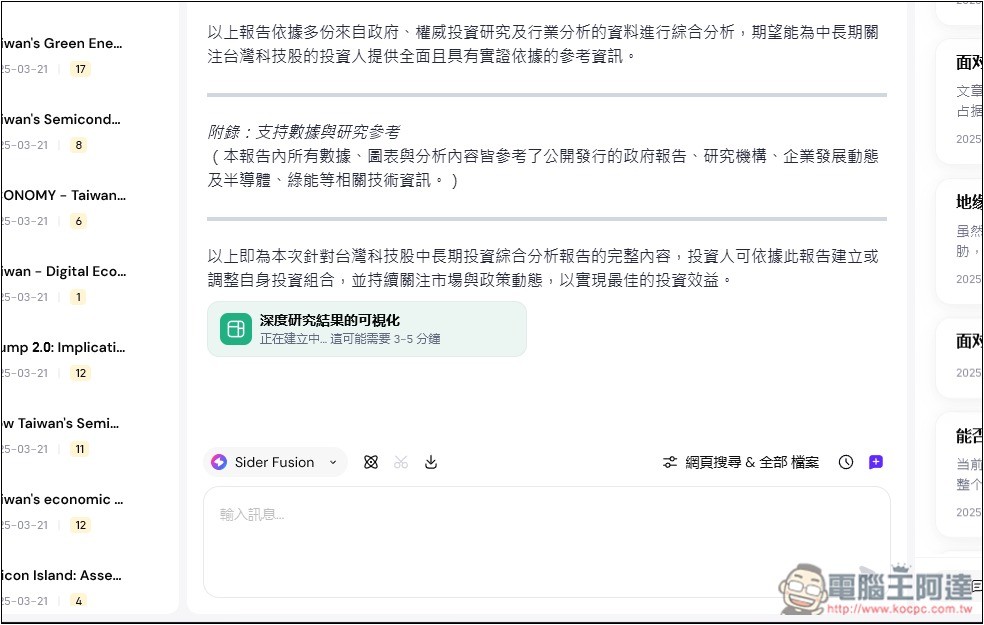
After completion, you can click to view. If you want to share the generated report content with others, please use the share button above the chat.This is my report on testing Deep Research., if you’re interested, you can take a read:
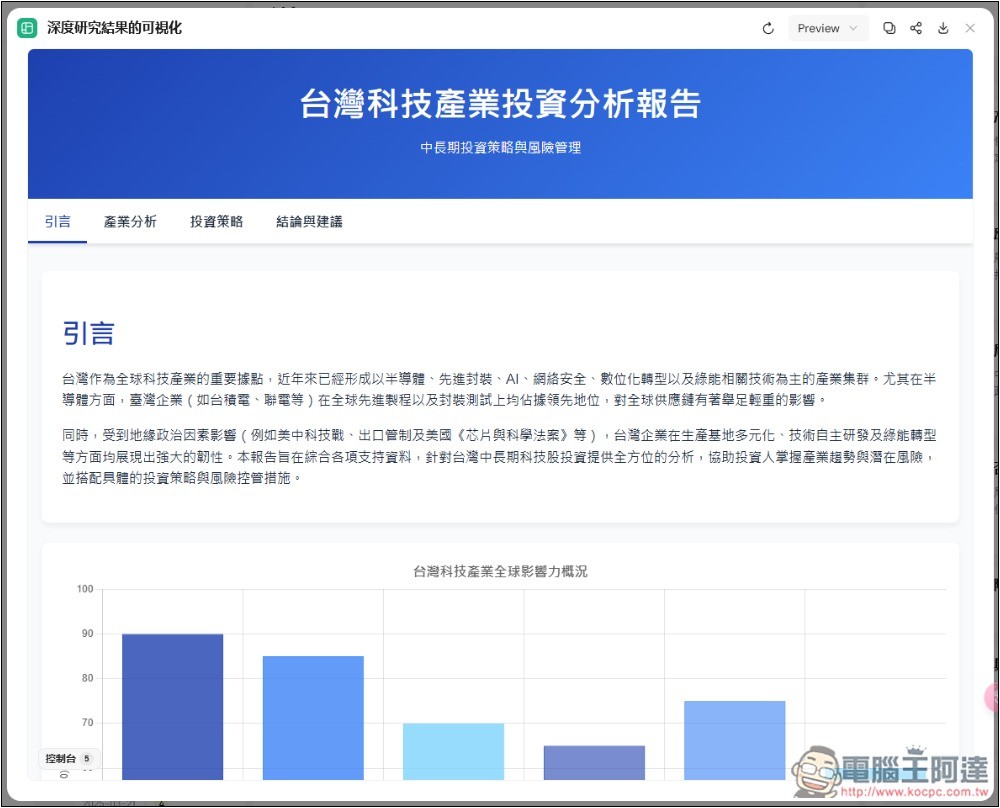
The visualization webpage looks like this—it’s really quite impressive, turning the original long report into a webpage with charts. If you like it, you can download the HTML and use it directly elsewhere:
Of course, but is the content completely accurate? Remember that you should still verify this yourself. With the current capabilities of AI, even with in-depth research, it can still provide incorrect information.
Source: KOCPC Chinese